. 2014 May 15;28(10):1042-7.
doi: 10.1101/gad.238881.114.

Higher chromatin mobility supports totipotency and precedes pluripotency in vivo

Affiliations

Higher chromatin mobility supports totipotency and precedes pluripotency in vivo

Ana Bošković et al. Genes Dev. .

Abstract

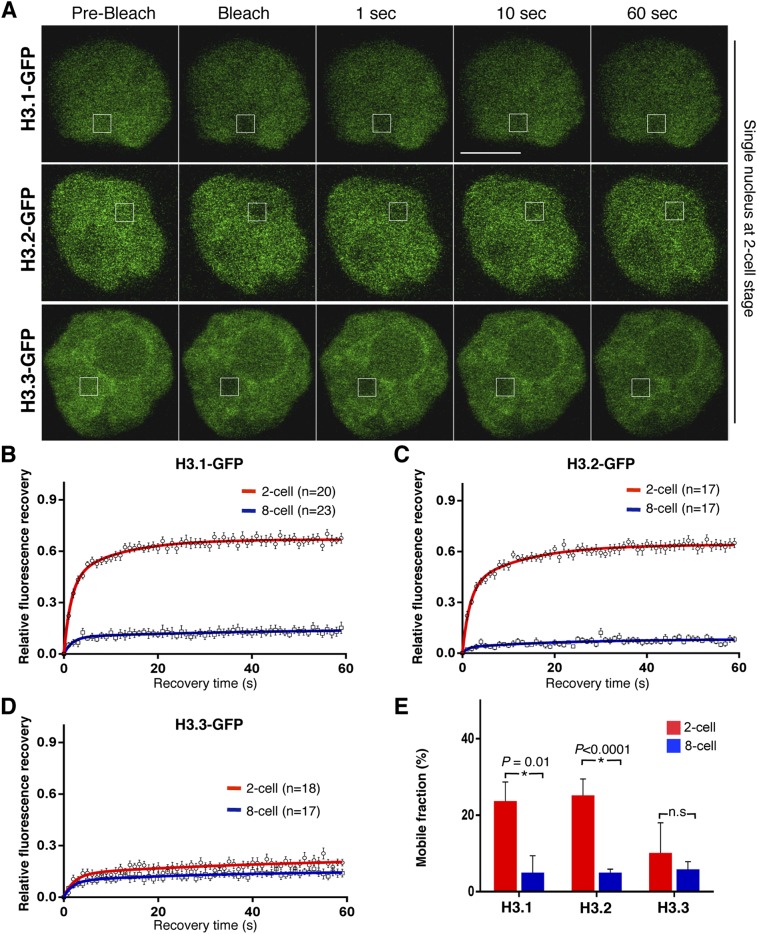
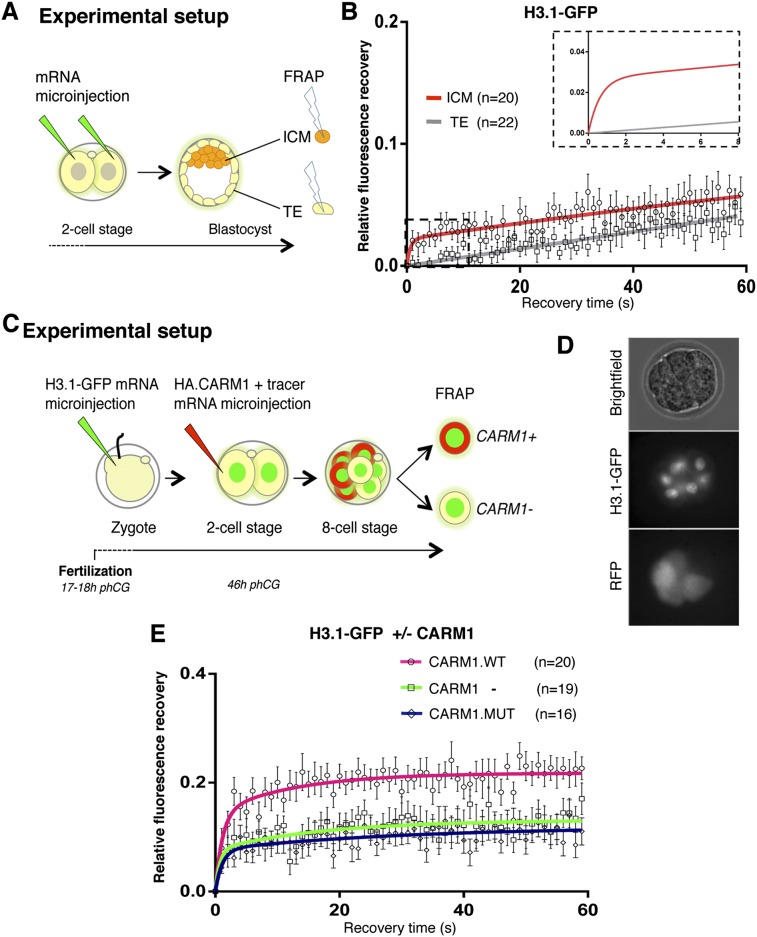
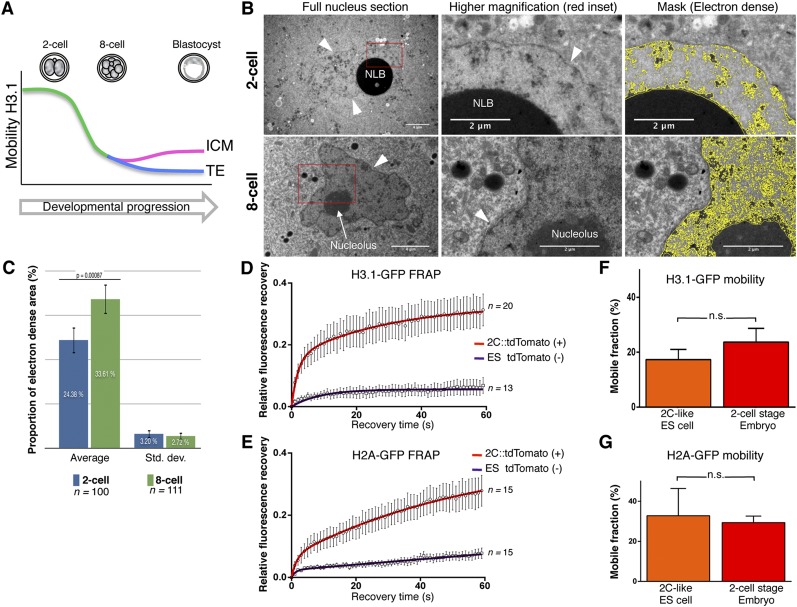
The fusion of the gametes upon fertilization results in the formation of a totipotent cell. Embryonic chromatin is expected to be able to support a large degree of plasticity. However, whether this plasticity relies on a particular conformation of the embryonic chromatin is unknown. Moreover, whether chromatin plasticity is functionally linked to cellular potency has not been addressed. Here, we adapted fluorescence recovery after photobleaching (FRAP) in the developing mouse embryo and show that mobility of the core histones H2A, H3.1, and H3.2 is unusually high in two-cell stage embryos and decreases as development proceeds. The transition toward pluripotency is accompanied by a decrease in histone mobility, and, upon lineage allocation, pluripotent cells retain higher mobility than the differentiated trophectoderm. Importantly, totipotent two-cell-like embryonic stem cells also display high core histone mobility, implying that reprogramming toward totipotency entails changes in chromatin mobility. Our data suggest that changes in chromatin dynamics underlie the transitions in cellular plasticity and that higher chromatin mobility is at the nuclear foundations of totipotency.

Keywords: cell fate; chromatin dynamics; pluripotency; reprogramming; totipotent cells.


Figures

Figure 1.
Figure 1.
FRAP analysis of chromatin components in the developing mouse embryo reveals a decrease in chromatin mobility of H2A-GFP. (A) Experimental setup for FRAP in embryos. Zygotes were collected and microinjected with in vitro transcribed mRNA and cultured until the indicated developmental stages, when they were subjected to FRAP. After imaging acquisition, embryos were cultured until the blastocyst stage, and their development was scored. (B) A representative nucleus of an eight-cell stage embryo expressing H2A-GFP during a FRAP experiment is shown. The bleached region is represented by a rectangle. Bar, 10 μm. (C) Representative single FRAP curves of H2A-GFP at the two-cell (red) and eight-cell (blue) stages. The bleach time point is indicated by an arrow. Recovery of H2A-GFP is significantly faster at the two-cell stage compared with the eight-cell stage. (D) Recovery curves of H2A-GFP at the two-cell (red) and eight-cell (blue) stages. Recovery was quantified in the bleached area over a 60-sec period, and the curves were normalized to zero to account for differences in bleach depth between experiments. Individual points are mean ± SEM, and mean values were fit into an exponential curve. (E) Estimated mobile fractions (±SEM) of H2A-GFP in two-cell and eight-cell stage embryos.
Figure 2.
Figure 2.
Mobility of core histones H3.1-GFP and H3.2-GFP decreases between the two-cell and the eight-cell stages, but H3.3-GFP mobility remains unchanged. (A) Nuclei of two-cell stage embryos expressing either H3.1-GFP (top), H3.2-GFP (middle), or H3.3-GFP (bottom) at the indicated time points during representative FRAP experiments. The bleached region is indicated by a rectangle. (B) FRAP curves for H3.1-GFP in two-cell and eight-cell stage embryos reveal higher mobility of H3.1-GFP at the earlier developmental stage. (C) H3.2-GFP FRAP curves at the two-cell and eight-cell stages. Two-cell stage embryos show an unusual, high mobility behavior of H3.2-GFP, which is dramatically decreased with developmental progression. (D) FRAP curves for H3.3-GFP at the two-cell and eight-cell stages show no significant change in H3.3 dynamics between the two stages. (E) Calculated mobile fractions (±SEM) of H3 variants at the two-cell and eight-cell stages. (BD) Values represent mean ± SEM of multiple embryos, where n indicates the number of nuclei analyzed. FRAP was performed in only one nucleus per embryo. The mean values were fit into an exponential curve. P-values were calculated using unpaired t-test between each two groups.
Figure 3.
Figure 3.
Pluripotent cells retain high chromatin mobility upon lineage allocation. (A) The two blastomeres of a two-cell stage embryo were microinjected with equal amounts of H3.1-GFP mRNA, and embryos were developed to the blastocyst stage. At embryonic day 3.5 (E3.5), a single nucleus of the ICM and in the TE was subjected to FRAP as in Figure 1. (B) Mean FRAP values for H3.1-GFP in the ICM (red line) and TE (gray line) over 60-sec period of recovery immediately after bleaching. The smaller graph in the top right corner represents a zoom of the dashed rectangle, which includes the first 8 sec post-bleach, in which data points are omitted for clarity. (C) Schematic representation of FRAP experiments to address chromatin mobility during lineage allocation. Zygotes were microinjected with H3.1-GFP mRNA as in Figure 1 and cultured until the late two-cell stage, when one blastomere was microinjected with HA.CARM1 mRNA and mRFP mRNA as tracer. Microinjection of HA.CARM1 mRNA at this stage allocates the progeny of the injected cell to the ICM (Torres-Padilla et al. 2007). (D) Representative eight-cell stage embryo after double microinjection. (Middle image) While all nuclei are H3.1-GFP-positive, only four blastomeres are RFP-positive (and HA.CARM1-positive). (E) FRAP curves for H3.1-GFP in HA.CARM1 wild-type-positive (pink line), HA.CARM1-negative (green line), and CARM1 catalytic death-positive (dark blue line) blastomeres at the eight-cell stage. In each embryo, one RFP-positive and one RFP-negative cell were analyzed by FRAP. Allocation of ICM fate through CARM1 expression increases H3.1-GFP mobility at the eight-cell stage. Under the same experimental conditions, the CARM1 catalytic mutant does not alter H3.1-GFP mobility.
Figure 4.
Figure 4.
Totipotent cells display unusually high chromatin mobility and loose chromatin ultrastructure. (A) Schematic summary of H3.1-GFP mobility throughout development. (B) Electron micrographs of two-cell (top) and eight-cell (bottom) stage nuclei. Nucleolar-like bodies (NLBs) and nucleoli are indicated; arrowheads point to the nuclear membrane. The higher magnification corresponds to the red inset. The right column shows the mask to segment electron-dense regions for quantification (see Supplemental Fig. S8 for details). Note that the NLBs are very electron-dense, presumably due to the presence of negatively charged proteins such as nucleoplasmin (Inoue and Aoki 2010). (C) Quantification of the relative electron-dense area in two-cell and eight-cell stage nuclei reveals an increase of chromatin compaction. The average and SD of the indicated number of sections analyzed are shown. (D,E) Mean FRAP values of H3.1-GFP (D) and H2A-GFP (E) in tdTomato-positive two-cell-like (2C) ES cells (red curve) compared with tdTomato-negative ES cells (purple curve) grown in LIF+2i medium. The number of cells analyzed is shown at the side of each curve. ES cells with 2C properties are characterized by dramatically higher H3.1 mobility compared with non-2C, pluripotent ES cells within the same population. (F,G) Mobile fractions (±SEM) of H3.1-GFP (F) and H2A-GFP (G) in 2C ES cells and two-cell stage embryos. While the variability is higher in the in vitro totipotent cells (2C-like), the high mobility of H3.1-GFP is comparable between in vitro 2C cells and in vivo in two-cell embryos. (n.s.) Non-significant (unpaired t-test).

References

    1. Ahmed K, Dehghani H, Rugg-Gunn P, Fussner E, Rossant J, Bazett-Jones DP 2010. Global chromatin architecture reflects pluripotency and lineage commitment in the early mouse embryo. PLoS ONE 5: e10531. - PMC - PubMed
    1. Akiyama T, Suzuki O, Matsuda J, Aoki F 2011. Dynamic replacement of histone H3 variants reprograms epigenetic marks in early mouse embryos. PLoS Genet 7: e1002279. - PMC - PubMed
    1. Burton A, Muller J, Tu S, Padilla-Longoria P, Guccione E, Torres-Padilla ME 2013. Single-cell profiling of epigenetic modifiers identifies PRDM14 as an inducer of cell fate in the mammalian embryo. Cell Rep 5: 687–701 - PubMed
    1. Chambers I, Colby D, Robertson M, Nichols J, Lee S, Tweedie S, Smith A 2003. Functional expression cloning of Nanog, a pluripotency sustaining factor in embryonic stem cells. Cell 113: 643–655 - PubMed
    1. Cremer T, Cremer C 2001. Chromosome territories, nuclear architecture and gene regulation in mammalian cells. Nat Rev Genet 2: 292–301 - PubMed

Publication types