

Genome-wide inference of ancestral recombination graphs
- PMID: 24831947
- PMCID: PMC4022496
- DOI: 10.1371/journal.pgen.1004342
Genome-wide inference of ancestral recombination graphs
Abstract
The complex correlation structure of a collection of orthologous DNA sequences is uniquely captured by the "ancestral recombination graph" (ARG), a complete record of coalescence and recombination events in the history of the sample. However, existing methods for ARG inference are computationally intensive, highly approximate, or limited to small numbers of sequences, and, as a consequence, explicit ARG inference is rarely used in applied population genomics. Here, we introduce a new algorithm for ARG inference that is efficient enough to apply to dozens of complete mammalian genomes. The key idea of our approach is to sample an ARG of [Formula: see text] chromosomes conditional on an ARG of [Formula: see text] chromosomes, an operation we call "threading." Using techniques based on hidden Markov models, we can perform this threading operation exactly, up to the assumptions of the sequentially Markov coalescent and a discretization of time. An extension allows for threading of subtrees instead of individual sequences. Repeated application of these threading operations results in highly efficient Markov chain Monte Carlo samplers for ARGs. We have implemented these methods in a computer program called ARGweaver. Experiments with simulated data indicate that ARGweaver converges rapidly to the posterior distribution over ARGs and is effective in recovering various features of the ARG for dozens of sequences generated under realistic parameters for human populations. In applications of ARGweaver to 54 human genome sequences from Complete Genomics, we find clear signatures of natural selection, including regions of unusually ancient ancestry associated with balancing selection and reductions in allele age in sites under directional selection. The patterns we observe near protein-coding genes are consistent with a primary influence from background selection rather than hitchhiking, although we cannot rule out a contribution from recurrent selective sweeps.
Conflict of interest statement
The authors have declared that no competing interests exist.
Figures
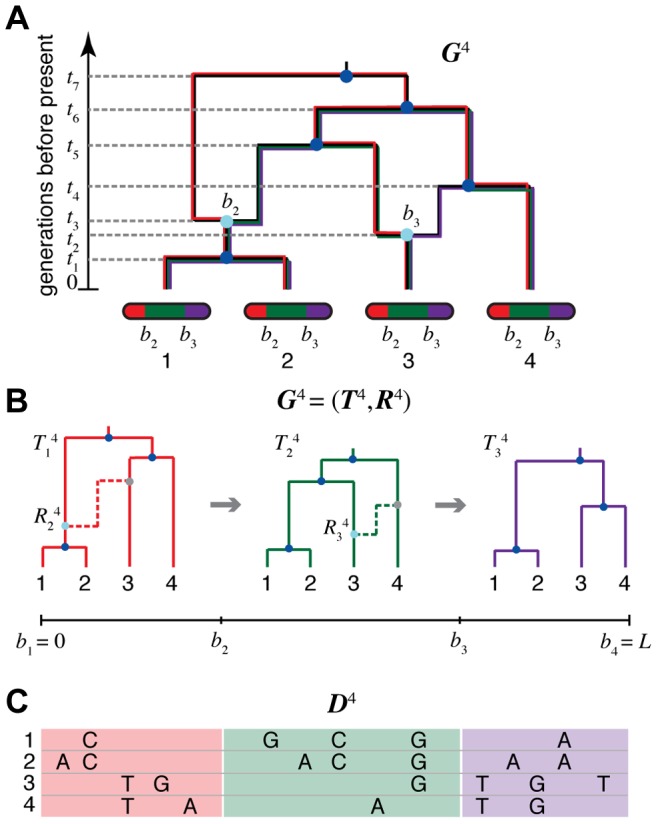
 and
and  ). Each non-recombining interval of the sequences (shown in red, green, and purple) corresponds to a “local tree” embedded in the ARG (shown in matching colors). Recombinations cause these trees to change along the length of the sequences, making the correlation structure of the data set highly complex. The ARG for four sequences is denoted
  in our notation. (B) Representation of
  in terms of a sequence of local trees
  and recombination events
  . A local tree
  is shown for each nonrecombining segment in colors matching those in (A). Each tree,
  , can be viewed as being constructed from the previous tree,
  , by placing a recombination event along the branches of
  (light blue circles), breaking the branch at this location, and then allowing the broken lineage to re-coalesce to the rest of the tree (dashed lines in matching colors; new coalescence points are shown in gray). Together, the local trees and recombinations provide a complete description of the ARG. The Sequentially Markov Coalescent (SMC) approximate the full coalescent-with-recombination by assuming that
  is statistically independent of all previous trees given
  . (C) An alignment of four sequences,
  , corresponding to the linearized ARG shown in (B). For simplicity, only the derived alleles at polymorphic sites are shown. The sequences are assumed to be generated by a process that samples an ancestral sequences from a suitable background distribution, then allows each nonrecombining segment of this sequence to mutate stochastically along the branches of the corresponding local tree. Notice that the correlation structure of the sequences is fully determined by the local trees; that is,
  is conditionally independent of the recombinations
  given the local trees
  .
.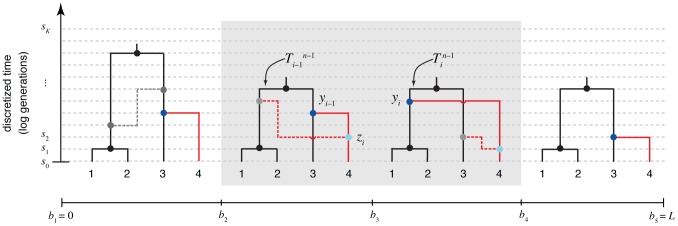
 th sequence to an ARG of
  sequences under a discretized version of the SMC (the DSMC) that requires all coalescence and recombination events to occur precisely at pre-defined time points,
  (horizontal dashed lines). In this example, the fourth sequence has been removed from ARG
  from Figure 1, leaving a tree with
  leaves at each position
  (
( ; shown in black). The fourth sequence (shown in red) is re-threaded through the remaining portion of the ARG by a two-step process that first samples a coalescence point
  for this sequence at each
  (dark blue points), thereby defining a new tree
  , and second, samples a recombination point
  to reconcile each adjacent pair of trees,
  (light blue points). For simplicity, only the distinct local trees for the four nonrecombining segments (after threading) are shown. The gray box highlights the pair of trees immediately flanking the breakpoint
  . Notice that the first recombination from Figure 1 is retained (dark gray nodes and dashed line in left-most tree). In general, new recombinations are prohibited at the locations of “given” recombinations
  (see text). Note that it is possible for the attachment point of the
  th sequence in the local trees to move due to old recombinations as well as new ones (not shown in this example).
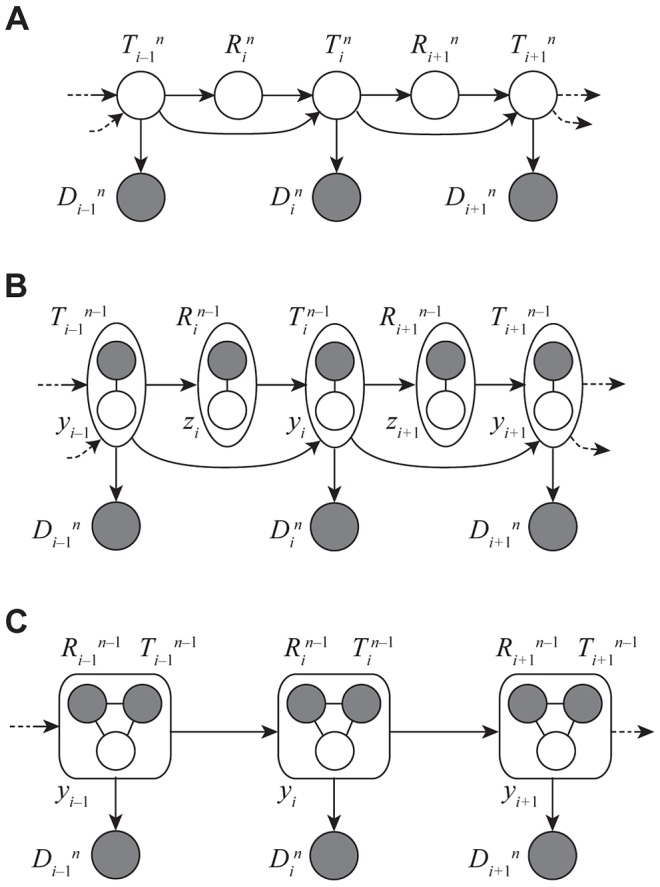
 samples with local trees,
  , recombinations,
  , and alignment columns,
  . Together,
  and
and  define an ancestral recombination graph,
  . Solid circles indicate observed variables and empty circles indicate latent variables. Arrows indicate direct dependencies between variables and correspond to conditional probability distributions described in the text. Notice that the
  variables can be integrated out of this model, leading to the conventional graph topology for a hidden Markov model. (B) The same model as in (A), but now partitioning the latent variables into components that describe the history of the first
  sequences (
 and
and  ) and components specific to the
  th sequence (
 and
and  ). The
  and
and  variables are represented by solid circles because they are now “clamped” at specific values. A sample of
  represents a threading of the
  th sequence through the ARG. (C) Reduced model after elimination of
  by integration, enabling efficient sampling of coalescent threadings
  . This is the model used by the first step in our two-step sampling approach. In the second step, the
  variables are sampled conditional on
  , separately for each
  . In this model, the grouped nodes have complex joint dependencies, leading to a heterogeneous state space and normalization structure, but the linear conditional independence structure of an HMM is retained.
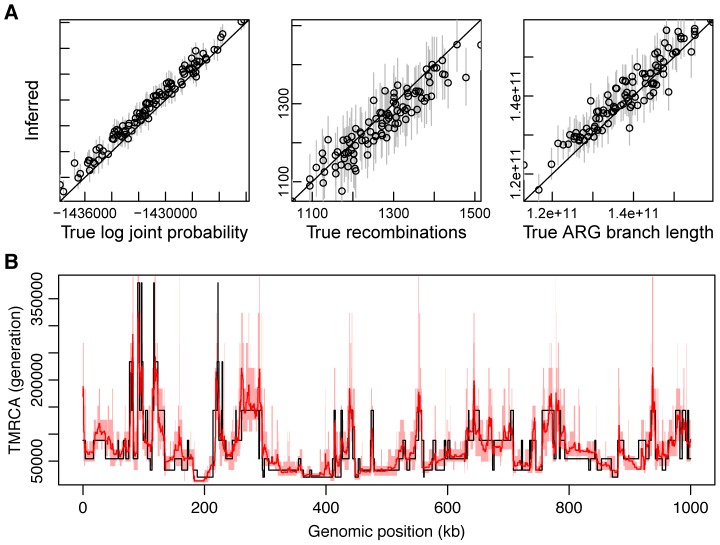
 (see Supplementary Figure 10 for additional results). From left to right are shown true (
 -axis) versus inferred (
 -axis) values of the log joint probability (the logarithm of equation 2), the total number of recombinations, and the total branch length of the ARG. Each data point in each plot represents one of 100 simulated data sets. In the vertical dimension, circles represent averages across 100 sampled ARGs based on the corresponding data sets, sampled at intervals of 10 after a burn-in of 200 iterations, and error bars represent the interval between the 2.5 and 97.5 percentiles. In the second and third plots, circles are interpretable as posterior expected values and error bars as 95% Bayesian credible intervals. (B) Posterior mean TMRCA (dark red line, with 95% credible intervals in light red) versus true TMRCA (black line) along a simulated genomic segment of 1 Mb. This plot is based on a single representative data set of 20 1-Mb sequences generated under our standard simulation parameters with
  (see Supplementary Figure S5 for additional results).
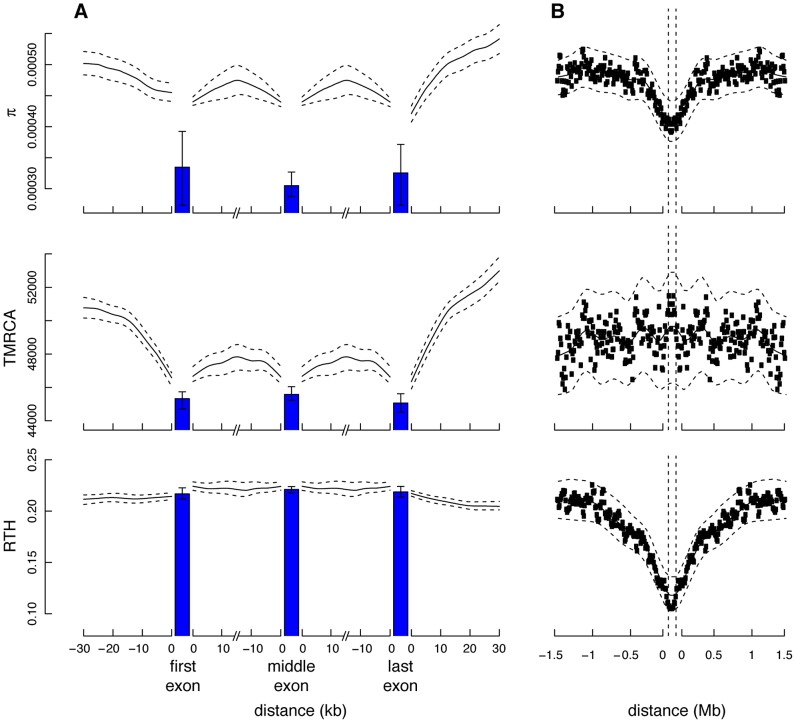
 ), time to most recent common ancestry (TMRCA), and relative TMRCA halflife (RTH) for the 13 individuals (26 haploid genomes) of European descent (CEU and TSI populations) in the Complete Genomics data set (similar plots for African population are shown in Supplementary Figure S11). Nucleotide diversity
  was computed as the average rate of nucleotide differences per site across all pairs of chromosomes, whereas sitewise values of the TMRCA and RTH were computed by averaging over local trees sampled by ARGweaver. (A) Estimates for 17,845 protein-coding genes from the Consensus Coding Sequence (CCDS) track in the UCSC Genome Browser (hg19). Estimates for noncoding regions were computed by averaging in a sliding window of size 300 bp then averaging across genes. Estimates for coding exons were computed by first averaging over fourfold degenerate (4d) sites of each exonic type (first, middle, last), then averaging across genes (see Methods). Only 4d sites were considered to focus on the influence of selection from linked sites rather than direct selection. Nevertheless, the decreased values for the exons suggest some influence from direct selection. The differences between exons and flanking sites may also be influenced by windowing in the noncoding regions. “First exon” is taken to begin at the annotated start codon and “last exon” to end at the stop codon, so that both exclude untranslated regions. The TMRCA is measured in thousands of generations. RTH is ratio of the time required for the first 50% of lineages to find a most recent common ancestor to the full TMRCA (see Supplementary Figure S10). Error bars (dashed lines for noncoding regions) indicate 95% confidence intervals as estimated by bootstrapping over regions. (B) Similar plots for 255 100-kb regions predicted to have undergone partial selective sweeps in the CEU population based on the iHS statistic . In this case, all measures are computed in a sliding window of 10,000 bases. Notice that both protein-coding genes and putative selective sweeps display substantial reductions in nucleotide diversity, but the genes show a much more prominent reduction in TMRCA, whereas the sweeps show a much more prominent reduction in RTH. These signatures are consistent with a dominant influence from background selection rather than hitchhiking in protein-coding genes (see text).
References
-
- Hein J, Schierup M, Wiuf C (2005) Gene genealogies, variation and evolution: a primer in coalescent theory. Oxford: Oxford University Press.
-
- Wakeley J (2009) Coalescent theory: an introduction. Greenwood Village: Roberts & Co. Publishers.
-
- Fisher RA (1930) The Genetical Theory of Natural Selection. Oxford: Oxford University Press.
Publication types
MeSH terms
Grants and funding
LinkOut - more resources
Full Text Sources
Other Literature Sources
Miscellaneous
