. 2014 Aug;22(8):1530-1543.
doi: 10.1038/mt.2014.86. Epub 2014 May 15.

Characterizing human stem cell-derived sensory neurons at the single-cell level reveals their ion channel expression and utility in pain research

Affiliations

Characterizing human stem cell-derived sensory neurons at the single-cell level reveals their ion channel expression and utility in pain research

Gareth T Young et al. Mol Ther. 2014 Aug.

Abstract

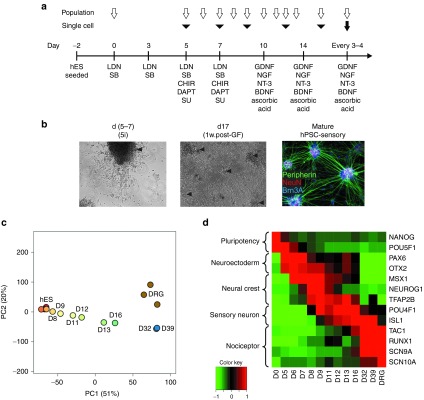
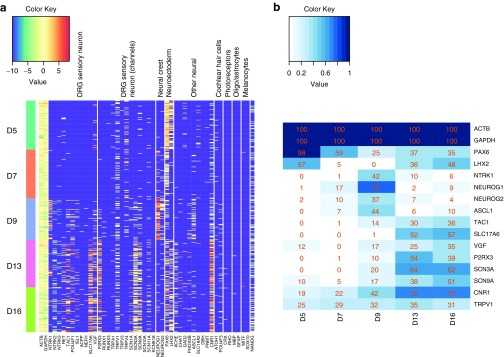
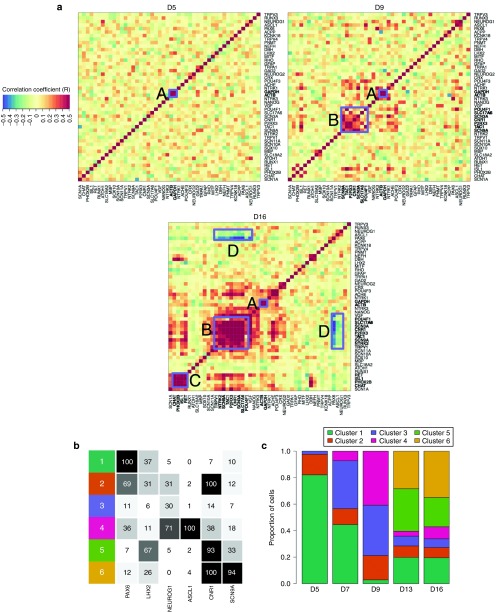
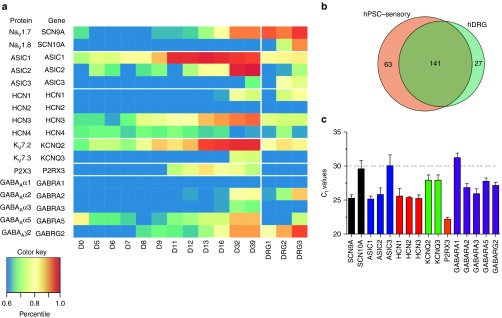
The generation of human sensory neurons by directed differentiation of pluripotent stem cells opens new opportunities for investigating the biology of pain. The inability to generate this cell type has meant that up until now their study has been reliant on the use of rodent models. Here, we use a combination of population and single-cell techniques to perform a detailed molecular, electrophysiological, and pharmacological phenotyping of sensory neurons derived from human embryonic stem cells. We describe the evolution of cell populations over 6 weeks of directed differentiation; a process that results in the generation of a largely homogeneous population of neurons that are both molecularly and functionally comparable to human sensory neurons derived from mature dorsal root ganglia. This work opens the prospect of using pluripotent stem-cell-derived sensory neurons to study human neuronal physiology and as in vitro models for drug discovery in pain and sensory disorders.


Figures

Figure 1
Figure 1
Directed differentiation produces neurons with a nociceptor phenotype. (a) Directed differentiation protocol for human pluripotent stem cells (hPSC)-sensory. LDN193189 (LDN), SB-431542 (SB), CHIR99021 (CHIR), and SU5402 (SU). Open arrows denote timing of microarray analysis, black arrowheads denote timing of single cell qPCR analysis, and the black arrow denotes timing of electrophysiological analysis. (b) Phase contrast images of hPSC-sensory through the differentiation protocol. Cellular morphology after 5i is seen in left panel with emerging islands of neuronal cell bodies (arrow head). After growth factor addition many neuronal islands can be seen (arrow heads) which stain positive for sensory neuronal markers peripherin, NeuN, and Brn3a (right panel), scale bar 400 µm. (c) Sample clustering based on a principal components analysis of genome-wide expression levels across all samples. Although measured in triplicate, for clarity each time point is represented by a single sample comprising the median expression level. Samples from the differentiating hES are colored red through blue according to the time of sampling. hDRG samples are colored brown. Key time points are labeled. The percentage of total variation accounted for by each principal component is given in parentheses. (d) Relative expression levels of key marker genes across the time course on log2 scale. The median expression levels of each gene across replicates are mean centered and scaled to unit variance. BDNF, brain-derived neurotrophic factor; GDNF, glial derived neurotrophic factor; hES, human embryonic stem cell; NGF, neuronal growth factor.
Figure 2
Figure 2
Expression of key marker genes at single cell resolution measured by qPCR. (a) Each row represents the expression levels measured from a single cell taken from the given time point. The measured genes are categorized according to the functional groupings given. In the case of no detectable expression, a color corresponding to the lowest level of detection is given (purple). (b) The percentage of cells with any detectable expression of the given genes at each time point. Genes were selected on the basis that expression was detected in >33% of cells at any one time point.
Figure 3
Figure 3
Intergene expression correlations and single-cell clustering. (a) Genes are clustered by hierarchical single linkage clustering based on the Euclidean distance between rows of the day 16 matrix. Red squares indicate high intracellular correlation between expression levels of pairs of genes. Four groupings of genes mentioned in the text are highlighted: (A) housekeeping genes; (B) sensory neuron markers; (C) sympathetic markers; (D) neuroectodermal and neural crest markers. (b) The percentage of cells in each of the six clusters of cells (1–6) identified by PAM expressing the given marker gene. (c) The proportion of all cells at each timepoint included in each cluster of cells.
Figure 4
Figure 4
Expression of sensory ion channel genes in human pluripotent stem cells (hPSC)-sensory during the directed differentiation time course and in hDRG samples. (a) The heatmap shows the expression values of selected ion channel genes given as percentiles of the genome wide expression levels. (b) The overlap between the total numbers of ion channel genes expressed in hPSC-sensory and hDRG is given in the Venn diagram. (c) qPCR analysis confirms the expression of sensory ion channels in hPSC-sensory.
Figure 5
Figure 5
GABAAreceptors in human pluripotent stem cells (hPSC)-sensory contain α2, α3, γ2 subunits and exhibit sensitivity to classical GABAA ligands. (a) GABA-induced inward currents were observed when hPSC-sensory cells were clamped at −60 mV. Representative traces in response to increasing concentrations of GABA can be seen in right panel and concentration–response curve in left panel (EC50 = ~100 µmol/l). (b) Reproducible IGABA were seen in response to an EC100 concentration of GABA (1 mmol/l) these currents were completely blocked by the noncompetitive pore blocker picrotoxin (control: 5.8 ± 1.4 pA/pF, picrotoxin: 50 µmol/l 0.0 ± 0.01 pA/pF, wash: 6.0 ± 1.7 pA/pF n = 5; top panel) and largely inhibited by the competitive ligand bicuculine (control: 6.9 ± 1.3 pA/pF, bicuculline: 50 µmol/l 0.9 ± 0.2 pA/pF, wash: 5.7 ± 1.3 pA/pF n = 5; bottom panel). (c) A submaximal concentration of GABA (EC20) was used to assess selective and nonselective GABAAR-positive allosteric modulators. Expression of γ2 was demonstrated by potentiation of IGABA with diazepam (10 µmol/l; 273.0 ± 53.6%, n = 7). Potentiation was observed with the α2/α3-preferring PAMs L838, 417 (1 µmol/l; 253.6 ± 29.3%, n = 9) and TPA023B (1 µmol/l; 148 ± 4.2%, n = 4), whereas minimal potentiation was observed with the α1-prefering PAM Zolpidem (10 nmol/l; 129.2% ± 2.8, n = 6). α5IA had little effect at IGABA (92.5 ± 3.6%, n = 4).
Figure 6
Figure 6
Human pluripotent stem cells (hPSC)-sensory express a fast cAMP-insensitive Ih indicative of HCN1 ion channels. (a) Hyperpolarization-activated currents (Ih) were observed in hPSC-sensory when cells were voltage-clamped from a Vh of −60 mV to hyperpolarizing test voltage steps from −65 to −120 mV in 5 mV increments (bottom panel). Utilizing tail current analysis (see Materials and Methods), the V1/2 of activation of Ih in hPSC-sensory was −84.7 ± 1.0 mV (n = 5). (b) Voltage relaxations (v-sag) typical of HCN-expressing neurons were observed in response to a hyperpolarizing injection in current-clamp mode (60 pA in this representative cell). (c) The average current density measured in voltage-clamp in response to a −120 mV voltage step was 31.8 ± 4.2 pA/pF (n = 10) in current-clamp mode an average of 0.3 ± 0.1 v-sag (n = 5) was observed in response to current injection achieving target voltages of ~−100 mV. (d) Activation kinetics were analyzed by fitting a double exponential to describe two activation rates (τfast and τslow). τfast kinetic analysis demonstrate a rapidly activating Ih similar to those observed in recombinant HCN1 ion channels. (e) Family of Ih traces in response to voltage steps as shown in a. In these examples, the cell was either measured in control conditions, forskolin-treated or in the presence of the Ih blocker cesium. (f) Voltage-activation curves for Ih were not affected following forskolin treatment (V1/2 in control = −84.74 ± 1.0 mV and forskolin-treated = −84.0 ± 1.1 mV; n = 5; not significantly different). Likewise, current densities measured at −120 mV were not different between control (36.4 ± 6.8 pA/pF) and forskolin-treated (33.0 ± 5.6 pA/pF) cells. (g) Ih was completely blocked by a short application of the HCN channel blocker cesium (control = 31.8 ± 4.2 pA/pF and cesium = 0.9 ± 0.4 pA/pF, n = 10).
Figure 7
Figure 7
Human pluripotent stem cell (hPSC)-sensory express KCNQ2/3 channels and a retigabine-sensitive IK(M) which contribute to resting membrane potential and regulate excitability. (a) IK(M) was identified utilizing an activation voltage-step protocol (bottom panel) a small slow current relaxation was observed when stepping to a −50 mV deactivation step resulting from IK(M) deactivation. (b) Retigabine- and ICA-069673-sensitive current were observed and quantified (retigabine: 1.2 ± 0.1 normalized current, n = 4; wash: 1.0 ± 0.1 normalized current, n = 4; ICA-069673: 1.3 ± 0.01, n = 4; wash: 0.9 ± 0.1, n = 4). (c) KCNQ2/3 openers affect hPSC-sensory membrane potential and excitability. Representative trace of action potential trains evoked with a depolarizing current injection. The KCNQ opener ICA-105665 hyperpolarizes the membrane potential resulting in fewer evoked action potentials in a concentration-dependent manner and could be rapidly washed. The initial resting membrane of −60 mV is represented by the red dotted line. (d) Representative experiment demonstrating the membrane potential for ICA-105665. (e) Quantification showing the inverse relationship between RMP and evoked action potentials in hPSC-sensory.
Figure 8
Figure 8
Human pluripotent stem cells (hPSC)-sensory express ASIC1/2 heteromers and ASIC3 homomeric ion channels. (a) Representative trace of an inward current in response to a pH drop from physiological (pH 7.4) to acidic (pH 6.0) conditions. (b) Concentration–response curve for hPSC-sensory expressed ASICs. Similarly to recombinantly expressed ASICs, the Hill slope is very steep (Hill slope = 3.9) with an IC50 = pH 6.5 (n = 7). Inset: non-normalized peak current densities observed at pH 6.0 (22.2 ± 1.7 pA/pF, n = 7). (c) IpH recovery from desensitization was measured by two pH 6.0 drops separated by a test recovery period. Currents were fully recovered with a recovery period between 120 and 240 seconds (τrecovery = 111.1 ± 19.8 seconds). (d) Representative traces to pH6 before (black traces) and after subunit-selective blockers psalmotoxin (ASIC1a left panel), mambalgin-1 (ASIC1a/b 2a/b middle panel), APETx2 (ASIC3 right panel). (e) Quantification of toxin inhibition as shown in d. Psalmotoxin exhibited limited to no inhibition of IpH in hPSC-sensory (0.9 ± 0.01 fraction of control, n = 11), whereas mambalgin-1 showed large inhibition demonstrating the presence of heteromeric ASICs (0.1 ± 0.01 fraction of control, n = 4). APETx2 showed small block (0.8 ± 0.1 fraction of control, n = 4) suggesting low levels of ASIC3 homomers.

Comment in

Similar articles

Cited by

References

    1. Robinton DA, Daley GQ. The promise of induced pluripotent stem cells in research and therapy. Nature. 2012;481:295–305. - PMC - PubMed
    1. Chambers SM, Fasano CA, Papapetrou EP, Tomishima M, Sadelain M, Studer L. Highly efficient neural conversion of human ES and iPS cells by dual inhibition of SMAD signaling. Nat Biotechnol. 2009;27:275–280. - PMC - PubMed
    1. Maroof AM, Keros S, Tyson JA, Ying SW, Ganat YM, Merkle FT, et al. Directed differentiation and functional maturation of cortical interneurons from human embryonic stem cells. Cell Stem Cell. 2013;12:559–572. - PMC - PubMed
    1. Dage JL, Colvin EM, Fouillet A, Langron E, Roell WC, Li J, et al. Pharmacological characterisation of ligand- and voltage-gated ion channels expressed in human iPSC-derived forebrain neurons. Psychopharmacology (Berl) 2014;231:1105–1124. - PubMed
    1. Park S, Lee KS, Lee YJ, Shin HA, Cho HY, Wang KC, et al. Generation of dopaminergic neurons in vitro from human embryonic stem cells treated with neurotrophic factors. Neurosci Lett. 2004;359:99–103. - PubMed