. 2014 May 15;9(5):e97593.
doi: 10.1371/journal.pone.0097593. eCollection 2014.

Reproducing on time when temperature varies: shifts in the timing of courtship by fiddler crabs

Affiliations

Reproducing on time when temperature varies: shifts in the timing of courtship by fiddler crabs

Kecia A Kerr et al. PLoS One. .

Abstract

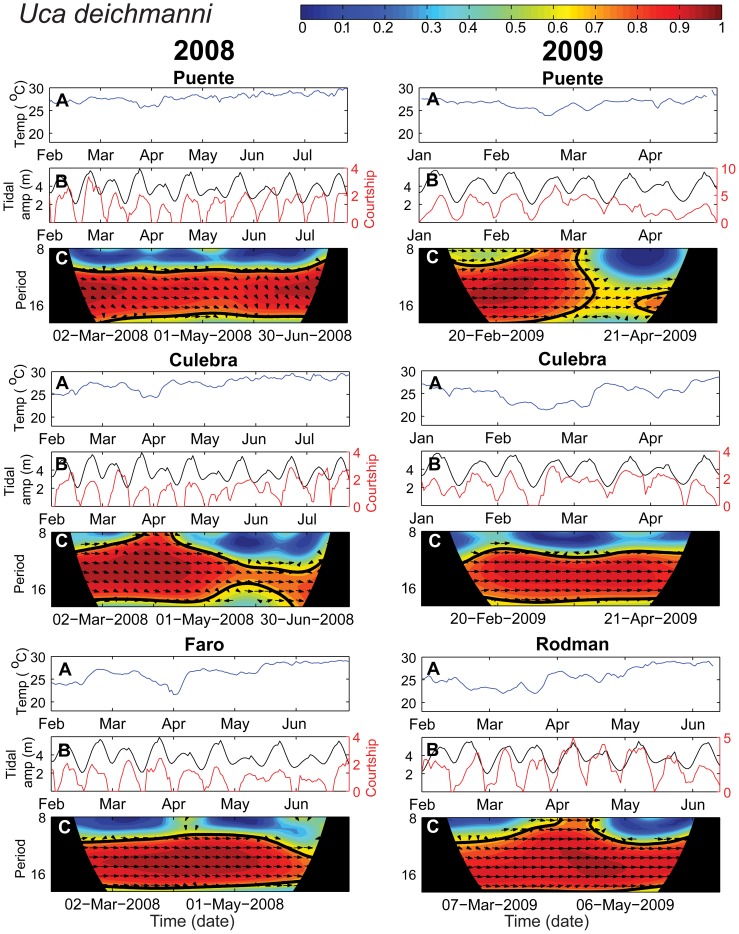
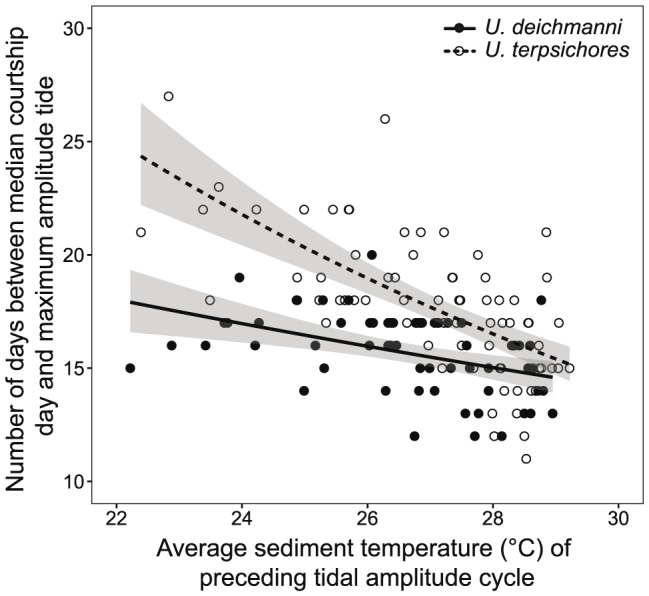
Many species reproduce when conditions are most favorable for the survival of young. Numerous intertidal fish and invertebrates release eggs or larvae during semilunar, large amplitude, nocturnal tides when these early life stages are best able to escape predation by fish that feed near the shore during the day. Remarkably, some species, including the fiddler crabs Uca terpsichores and Uca deichmanni, maintain this timing throughout the year as temperature, and thus the rate of embryonic development, vary. The mechanisms that allow such precision in the timing of the production of young are poorly known. A preliminary study suggested that when temperature decreases, U. terpsichores mate earlier in the tidal amplitude cycle such that larvae are released at the appropriate time. We tested this idea by studying the timing of courtship in U. terpsichores and U. deichmanni as temperature varied annually during two years, at 5 locations that differed in the temperature of the sediment where females incubate their eggs. Uca terpsichores courted earlier at locations where sediment temperature declined seasonally but not where sediment temperature remained elevated throughout the year. In contrast, clear shifts in courtship timing were not observed for U. deichmanni despite variation in sediment temperature. We discuss other mechanisms by which this species may maintain reproductive timing. These two species are likely to be affected differently by changes in the frequency and intensity of cold periods that are expected to accompany climate change.


Conflict of interest statement

Competing Interests: Co-author Fred Guichard is a PLOS ONE Editorial Board member. This does not alter the authors' adherence to all the PLOS ONE policies on sharing data and materials.

Figures

Figure 1
Figure 1. Study area.
Location of study sites near the Pacific entrance to the Panama Canal in the Bay of Panama. Land is represented by gray shading and water is shown in white.
Figure 2
Figure 2. Temperature correlograms.
Predictability in temperature during the upwelling season in both years expressed as the strength of the autocorrelation between the temperature on a given day and 1–30 days (lag) in the future. Water temperature (top row) was measured at 1 m depth in Culebra Bay. Sediment temperature was recorded at 20 cm depth in the habitat of each species at the coldest site for which we have data for both years (middle and bottom rows). Autocorrelation function values greater than the dashed horizontal line differ significantly from zero. Lags equivalent to the range of field measurements of incubation periods of both species during upwelling in 2009 are highlighted in bold (Uca deichmanni: 9–16 days, U. terpsichores: 14–21 days, Kerr et al. 2012, note that incubation period data is not available for 2008, but would have been shorter on average based on the relationship between temperature and incubation period). Significant autocorrelation at lags equivalent to the incubation period indicates that water temperature is predictable at the scale of the period of incubation.
Figure 3
Figure 3. Wavelet coherence of courtship intensity and tidal amplitude.
Time series of temperature (A), courtship intensity (square root of average number of males courting during the three scan samples, red line) and tidal amplitude (shifted one cycle earlier in time, black line) (B), and the wavelet coherence plot (C) for Uca terpsichores at Culebra for February to August 2008. In C, warmer colors represent stronger correlations between the courtship and tidal amplitude time series with dark blue indicating no correlation (0) and dark red indicating perfect correlation (1). When the correlation reaches a threshold level (0.5), arrows represent the phase relationship between the time series: right  =  in phase, left  =  anti-phase (180 degree offset between the time series), up or down  =  one time series is offset by 90 degrees from the other. The bold black line surrounding dark red areas indicates significant correlations between the two time series at the 5% level against red (AR1) noise. Data near the beginning and end of the time series can produce unreliable results and are thus covered by black on the plot (referred to as the “cone of influence” [47]). The time period of interest, one tidal amplitude cycle (12–17 days), is highlighted in bright colors. In subsequent figures, the wavelet coherence plots exclude periods outside this area of interest.
Figure 4
Figure 4. Temperature, tidal amplitude and Uca terpsichores courtship intensity.
Wavelet coherence results for U. terpsichores for two sites in 2008 and four sites in 2009. See the Figure 3 caption for an explanation of the panels A, B and C. Only the period lengths (y-axis) of approximately one tidal amplitude cycle (12–17 days), the area of interest, and a buffer of a few days on either side are shown in plot C.
Figure 5
Figure 5. Temperature, tidal amplitude and Uca deichmanni courtship intensity.
Wavelet coherence results for U. deichmanni courtship and tidal amplitude for three sites in 2008 and 2009. Panels A, B and C as explained for Figure 3. Only the period lengths (y-axis) of approximately one tidal amplitude cycle (12–17 days), the area of interest, and a buffer of a few days on either side are shown in plot C.
Figure 6
Figure 6. Median courtship timing vs sediment temperature.
The number of days between the median courtship day and the night in the following tidal amplitude cycle with the largest amplitude tide (target day for larval release) versus sediment temperature for Uca terpsichores (N = 74) and Uca deichmanni (N = 59) (Gamma GLM, log link, Temperature: F = 53.17, P<<0.001, Species: F = 44.57, P<<0.001, Temperature * Species: F = 8.71, P = 0.004). Median courtship day was defined as the day when the cumulative proportion of all males observed courting during the courtship cycle surpassed 0.5. Sediment temperature is the average temperature at 20 cm depth during the preceding tidal cycle (minimum amplitude tide to minimum amplitude tide).

Similar articles

Cited by

References

    1. Harley CDG, Randall Hughes A, Hultgren KM, Miner BG, Sorte CJB, et al. (2006) The impacts of climate change in coastal marine systems. Ecology Letters 9: 228–241. - PubMed
    1. Kordas RL, Harley CDG, O'Connor MI (2011) Community ecology in a warming world: The influence of temperature on interspecific interactions in marine systems. Journal of Experimental Marine Biology and Ecology 400: 218–226.
    1. Parmesan C (2006) Ecological and Evolutionary Responses to Recent Climate Change. Annual Review of Ecology, Evolution, and Systematics 37: 637–669.
    1. Visser ME (2008) Keeping up with a warming world; assessing the rate of adaptation to climate change. Proceedings of the Royal Society B: Biological Sciences 275: 649–659. - PMC - PubMed
    1. Walther GR, Post E, Convey P, Menzel A, Parmesan C, et al. (2002) Ecological responses to recent climate change. Nature 416: 389–395. - PubMed

Publication types

LinkOut - more resources