Obesity and the natural environment across US counties
- PMID: 24832148
- PMCID: PMC4056217
- DOI: 10.2105/AJPH.2013.301838
Obesity and the natural environment across US counties
Abstract
Objectives: We estimated the association between obesity and features of the natural environment. We asked whether the association is mediated by diet or by physical activity.
Methods: Using county-level data from the contiguous United States, we regressed adult obesity prevalence on 9 measures of the natural environment. Our regression model accounted for spatial correlation, and controlled for county demographics and the built environment. We included physical activity and diet (proxied by food purchases) as potential mediators.
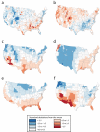
Results: Obesity was more prevalent in counties that are hot in July or cold in January. To a lesser degree, obesity was more prevalent in counties that are dark in January or rainy (but not snowy) year-round. Other aspects of the natural environment-including wind, trees, waterfront, and hills and mountains-had little or no association with obesity. Nearly all of the association between obesity and the natural environment was mediated by physical activity; none was mediated by diet.
Conclusions: Hot summers and cold winters appear to promote obesity by discouraging physical activity. Attempts to encourage physical activity should compensate for the effects of extreme temperatures.
Figures
Comment in
-
von Hippel and Benson respond.Am J Public Health. 2014 Nov;104(11):e2. doi: 10.2105/AJPH.2014.302204. Epub 2014 Sep 11. Am J Public Health. 2014. PMID: 25211718 Free PMC article. No abstract available.
-
Obesity prevention: Gore-Tex or sunscreen?Am J Public Health. 2014 Nov;104(11):e1-2. doi: 10.2105/AJPH.2014.302179. Epub 2014 Sep 11. Am J Public Health. 2014. PMID: 25211752 Free PMC article. No abstract available.
References
-
- Feng J, Glass TA, Curriero FC, Stewart WF, Schwartz BS. The built environment and obesity: a systematic review of the epidemiologic evidence. Health Place. 2010;16(2):175–190. - PubMed
-
- Togo F, Watanabe E, Park H, Shephard RJ, Aoyagi Y. Meteorology and the physical activity of the elderly: the Nakanojo Study. Int J Biometeorol. 2005;50(2):83–89. - PubMed
MeSH terms
LinkOut - more resources
Full Text Sources
Other Literature Sources
Medical


