

Flow cytometry pulse width data enables rapid and sensitive estimation of biomass dry weight in the microalgae Chlamydomonas reinhardtii and Chlorella vulgaris
- PMID: 24832156
- PMCID: PMC4022489
- DOI: 10.1371/journal.pone.0097269
Flow cytometry pulse width data enables rapid and sensitive estimation of biomass dry weight in the microalgae Chlamydomonas reinhardtii and Chlorella vulgaris
Abstract
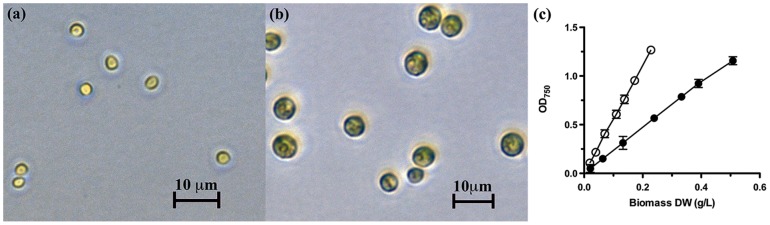
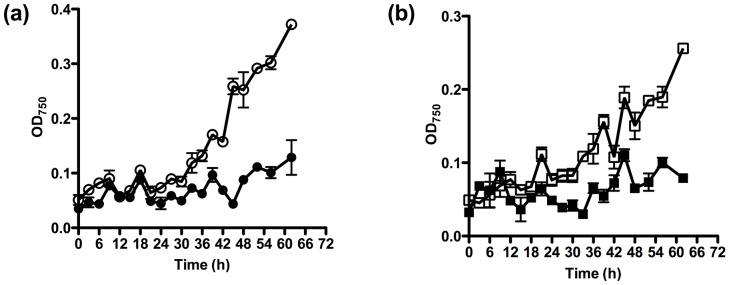
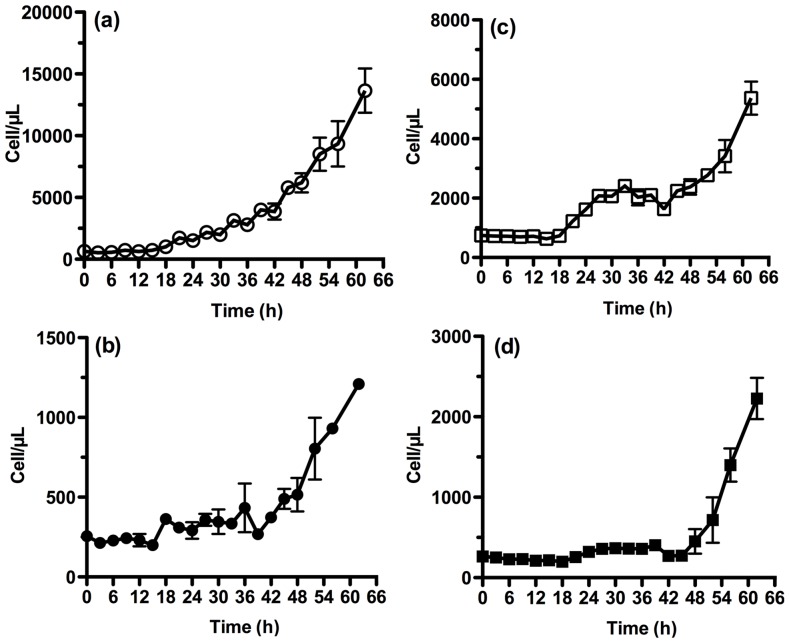
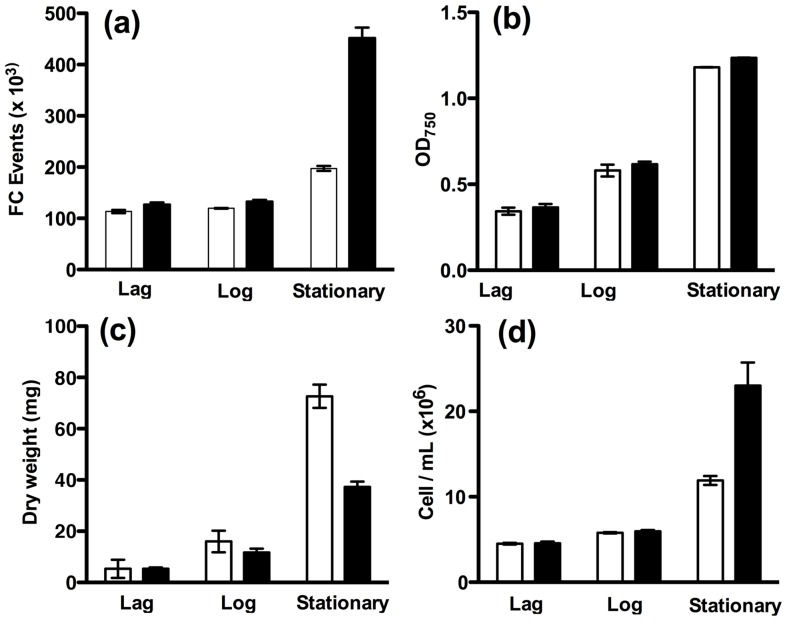
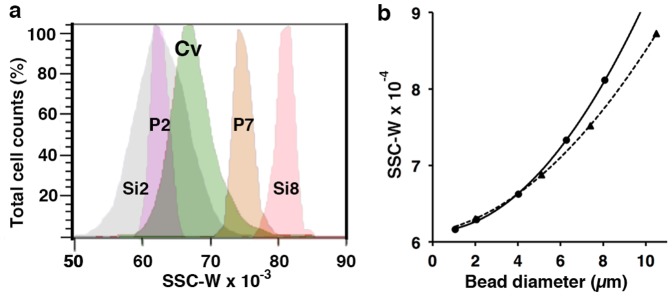
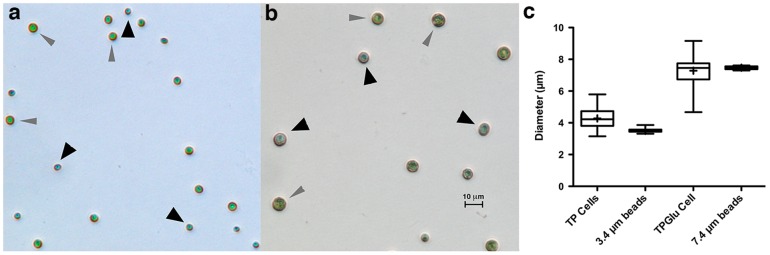
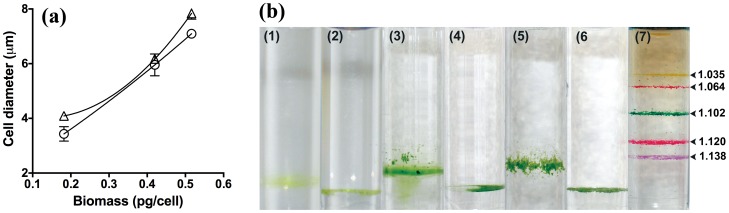
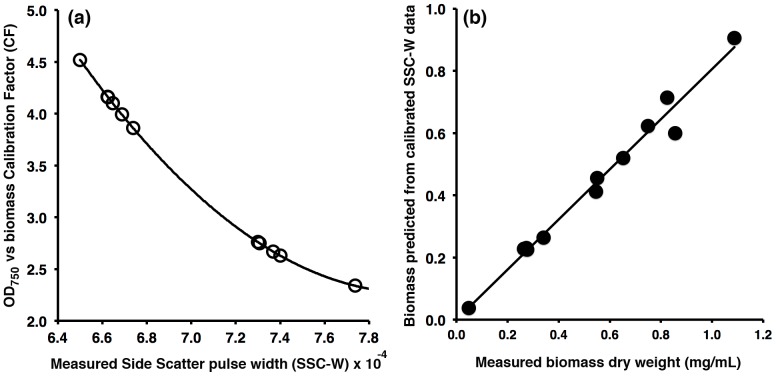
Dry weight biomass is an important parameter in algaculture. Direct measurement requires weighing milligram quantities of dried biomass, which is problematic for small volume systems containing few cells, such as laboratory studies and high throughput assays in microwell plates. In these cases indirect methods must be used, inducing measurement artefacts which vary in severity with the cell type and conditions employed. Here, we utilise flow cytometry pulse width data for the estimation of cell density and biomass, using Chlorella vulgaris and Chlamydomonas reinhardtii as model algae and compare it to optical density methods. Measurement of cell concentration by flow cytometry was shown to be more sensitive than optical density at 750 nm (OD750) for monitoring culture growth. However, neither cell concentration nor optical density correlates well to biomass when growth conditions vary. Compared to the growth of C. vulgaris in TAP (tris-acetate-phosphate) medium, cells grown in TAP + glucose displayed a slowed cell division rate and a 2-fold increased dry biomass accumulation compared to growth without glucose. This was accompanied by increased cellular volume. Laser scattering characteristics during flow cytometry were used to estimate cell diameters and it was shown that an empirical but nonlinear relationship could be shown between flow cytometric pulse width and dry weight biomass per cell. This relationship could be linearised by the use of hypertonic conditions (1 M NaCl) to dehydrate the cells, as shown by density gradient centrifugation. Flow cytometry for biomass estimation is easy to perform, sensitive and offers more comprehensive information than optical density measurements. In addition, periodic flow cytometry measurements can be used to calibrate OD750 measurements for both convenience and accuracy. This approach is particularly useful for small samples and where cellular characteristics, especially cell size, are expected to vary during growth.
Conflict of interest statement
Figures
Similar articles
-
Growth parameters and responses of green algae across a gradient of phototrophic, mixotrophic and heterotrophic conditions.PeerJ. 2022 Jul 21;10:e13776. doi: 10.7717/peerj.13776. eCollection 2022. PeerJ. 2022. PMID: 35891646 Free PMC article.
-
Achieving pH control in microalgal cultures through fed-batch addition of stoichiometrically-balanced growth media.BMC Biotechnol. 2013 May 7;13:39. doi: 10.1186/1472-6750-13-39. BMC Biotechnol. 2013. PMID: 23651806 Free PMC article.
-
Bioavailability of wastewater derived dissolved organic nitrogen to green microalgae Selenastrum capricornutum, Chlamydomonas reinhardtii, and Chlorella vulgaris with/without presence of bacteria.J Environ Sci (China). 2017 Jul;57:346-355. doi: 10.1016/j.jes.2016.12.017. Epub 2017 Jan 15. J Environ Sci (China). 2017. PMID: 28647256
-
Harvesting microalgae cultures with superabsorbent polymers: desulfurization of Chlamydomonas reinhardtii for hydrogen production.Biotechnol Bioeng. 2013 Dec;110(12):3227-34. doi: 10.1002/bit.24989. Epub 2013 Jul 15. Biotechnol Bioeng. 2013. PMID: 23797775
-
Photosynthetic light reactions increase total lipid accumulation in carbon-supplemented batch cultures of Chlorella vulgaris.Bioresour Technol. 2015 Mar;179:159-164. doi: 10.1016/j.biortech.2014.11.098. Epub 2014 Nov 29. Bioresour Technol. 2015. PMID: 25543540
Cited by
-
Light Influences the Growth, Pigment Synthesis, Photosynthesis Capacity, and Antioxidant Activities in Scenedesmus falcatus.Scientifica (Cairo). 2024 Jan 23;2024:1898624. doi: 10.1155/2024/1898624. eCollection 2024. Scientifica (Cairo). 2024. PMID: 38293704 Free PMC article.
-
Concentration vs. Optical Density of ESKAPEE Bacteria: A Method to Determine the Optimum Measurement Wavelength.Sensors (Basel). 2024 Dec 21;24(24):8160. doi: 10.3390/s24248160. Sensors (Basel). 2024. PMID: 39771895 Free PMC article.
-
Optimization of Ralstonia solanacearum cell growth using a central composite rotational design for the P(3HB) production: Effect of agitation and aeration.PLoS One. 2019 Jan 29;14(1):e0211211. doi: 10.1371/journal.pone.0211211. eCollection 2019. PLoS One. 2019. PMID: 30695062 Free PMC article.
-
Exploring the Role of a Cytokinin-Activating Enzyme LONELY GUY in Unicellular Microalga Chlorella variabilis.Front Plant Sci. 2021 Jan 29;11:611871. doi: 10.3389/fpls.2020.611871. eCollection 2020. Front Plant Sci. 2021. PMID: 33613586 Free PMC article.
-
Evaluation of Cellular Responses by Chlamydomonas reinhardtii in Media Containing Dairy-Processing Residues Derived from Cheese as Nutrients by Analyzing Cell Growth Activity and Comprehensive Gene Transcription Levels.Microorganisms. 2024 Mar 31;12(4):715. doi: 10.3390/microorganisms12040715. Microorganisms. 2024. PMID: 38674659 Free PMC article.
References
-
- Stephens E, Ross IL, King Z, Mussgnug JH, Kruse O, et al. (2010) An economic and technical evaluation of microalgal biofuels. Nat Biotechnol 28: 126–128. - PubMed
-
- Madrid RE, Felice CJ (2005) Microbial biomass estimation. Crit Rev Biotechnol 25: 97–112. - PubMed
-
- Zhu CJ, Lee YK (1997) Determination of biomass dry weight of marine microalgae. J Appl Phycol 9: 189–194.
-
- Jahnke J, Mahlmann DM, Jacobs P, Priefer UB (2011) The influence of growth conditions on the cell dry weight per unit biovolume of Klebsormidium flaccidum (Charophyta), a typical ubiquitous soil alga. J Appl Phycol 23: 655–664.
-
- Alcaraz M, Saiz E, Calbet A, Trepat I, Broglio E (2003) Estimating zooplankton biomass through image analysis. Mar Biol 143: 307–315.
Publication types
MeSH terms
Substances
LinkOut - more resources
Full Text Sources
Other Literature Sources
Miscellaneous
