. 2014 May 15;10(5):e1004123.
doi: 10.1371/journal.ppat.1004123. eCollection 2014 May.

T cell inactivation by poxviral B22 family proteins increases viral virulence

Affiliations

T cell inactivation by poxviral B22 family proteins increases viral virulence

Dina Alzhanova et al. PLoS Pathog. .

Abstract

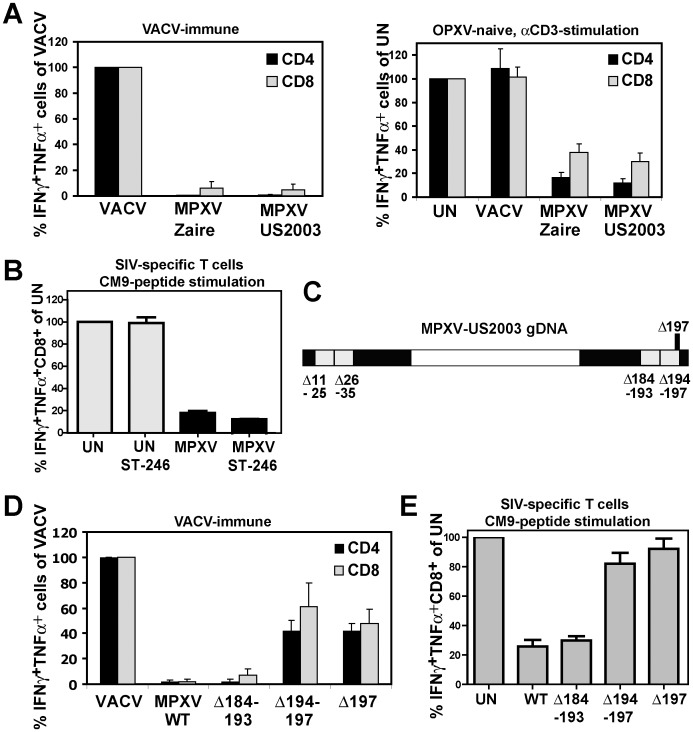
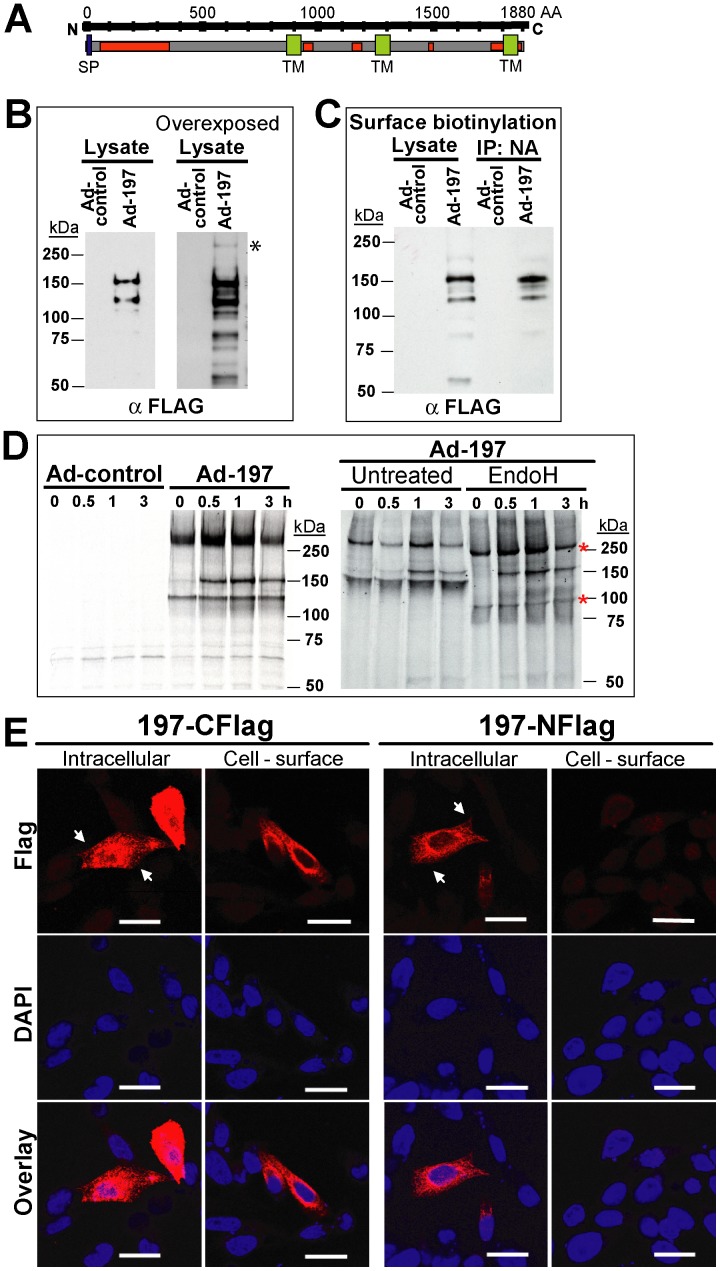
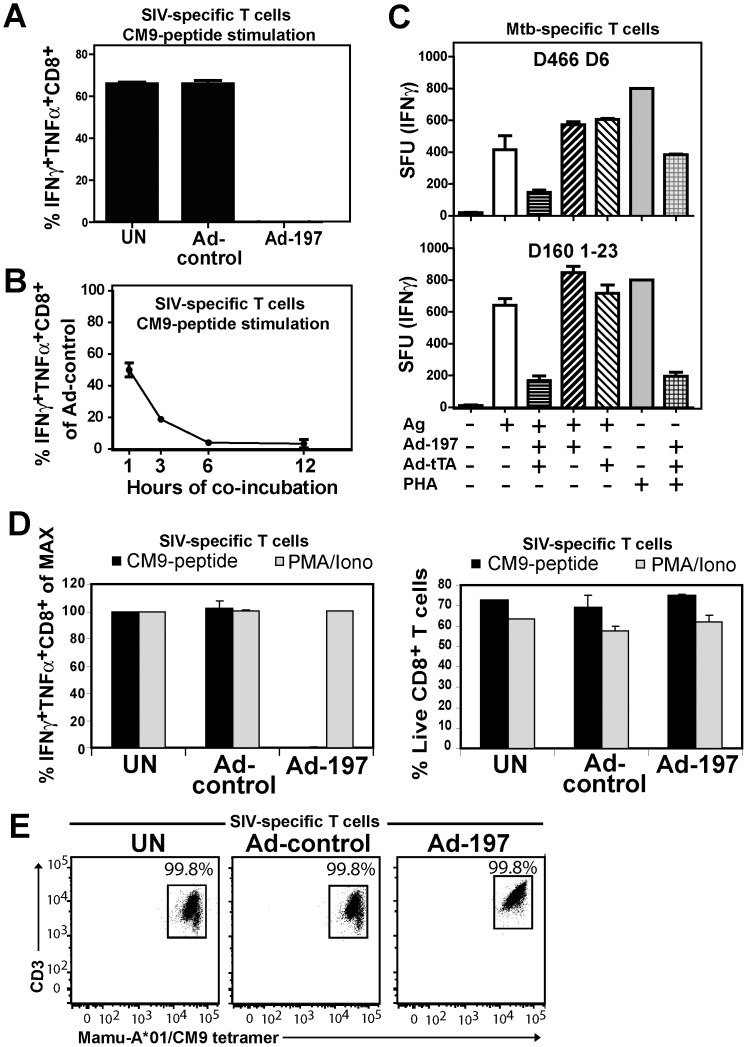
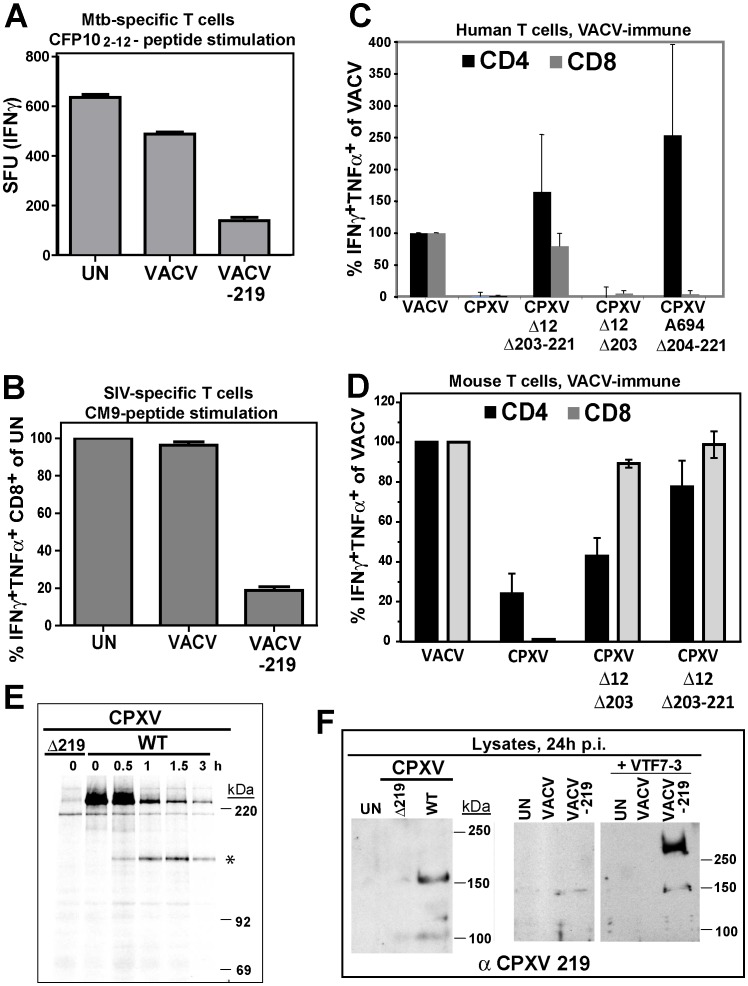
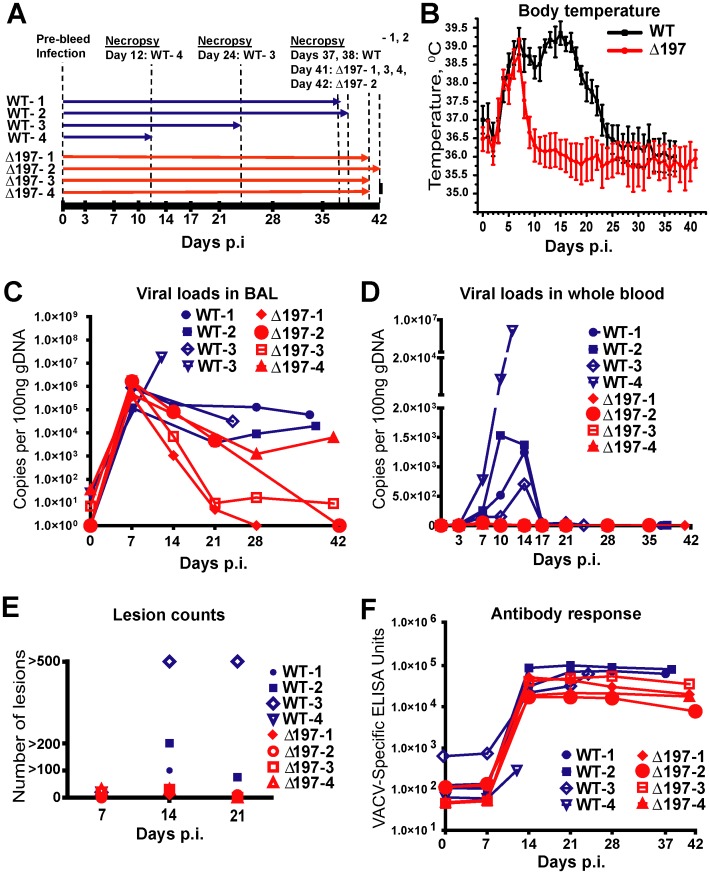
Infections with monkeypox, cowpox and weaponized variola virus remain a threat to the increasingly unvaccinated human population, but little is known about their mechanisms of virulence and immune evasion. We now demonstrate that B22 proteins, encoded by the largest genes of these viruses, render human T cells unresponsive to stimulation of the T cell receptor by MHC-dependent antigen presentation or by MHC-independent stimulation. In contrast, stimuli that bypass TCR-signaling are not inhibited. In a non-human primate model of monkeypox, virus lacking the B22R homologue (MPXVΔ197) caused only mild disease with lower viremia and cutaneous pox lesions compared to wild type MPXV which caused high viremia, morbidity and mortality. Since MPXVΔ197-infected animals displayed accelerated T cell responses and less T cell dysregulation than MPXV US2003, we conclude that B22 family proteins cause viral virulence by suppressing T cell control of viral dissemination.


Conflict of interest statement

The authors have declared that no competing interests exist.

Figures

Figure 1
Figure 1. MPXV197 is required for T cell inhibition by MPXV.
A) Left Panel: PBMC from VACV-immune subjects (n = 4) were infected with VACV, MPXV Zaire or MPXV US2003 (MOI of 0.5) for 18 h. Poxvirus-specific CD4+ and CD8+ T cell responses were measured by ICCS. Results are normalized to % of VACV-specific response. Right Panel: PBMC from VACV-naïve subjects (n = 3) were infected with indicated viruses or uninfected (UN) and T cells were stimulated with plate-bound αCD3 Ab for 6 h. B) CM9-specific RM CD8+ T-cells were incubated with HFF infected with MPXV US2003 (MOI of 2) in the presence or absence of 10 µM ST246 for 18 h prior to stimulation with CM9-peptide pulsed BLCL cells for 6.5 h. The percentage of IFNγ+TNFα+ cells as measured by ICCS is shown. C) Map of 10 Kb deletions (light grey) or a single ORF 197 deletion (black) in the terminal regions of the MPXV US2003 genome (black). D) Human CD4+ and CD8+ T cell responses to MPXV deletion mutants were determined by ICCS as in A). Infection rates of CD14+ monocytes in PBMC for MPXV US2003, MPXVΔ184-193, MPXVΔ194-197, and MPXVΔ197 were 73%, 81%, 65%, and 70%, respectively. E) Inhibition of CM9-specific CD8+ T-cell stimulation by MPXV US2003 or deletion mutants was measured by ICCS as in B). T cells were co-incubated with HFF cells infected with indicated viruses (MOI of 2, 10 µM ST246) for 18 h and then stimulated with CM9-peptide pulsed BLCLs for 6.5 h.
Figure 2
Figure 2. Molecular characterization and sub-cellular localization of MPXV197.
A) Schematic representation of MPXV 197 with predicted signal peptide (SP, blue, SignalP), transmembrane domains (TM, green, TMPred), and N-linked glycosylation sites (red, NetNGlyc 1.0). B) CHO cells were transduced with Ad-197/Ad-tTA (‘Ad-197’) or Ad-tTA only (‘Ad-control’) for 24 hours and lysed in sample buffer prior to electrophoretic separation and immunoblotting with αFLAG. Right panel: Overexposure reveals a >250 kDa band (asterisk). C) CHO cells were transduced as in B). After 24 h, cell surface proteins were biotinylated followed by immunoprecipitation with NeutrAvidin, electrophoretic separation and immunoblotting with αFLAG. D) 24 h after transduction with the indicated expression vectors, CHO cells were metabolically labeled for 45 min followed by chase for 0.5, 1, and 3 h. Cell lysates were immunoprecipitated with αFLAG. In the right panel, samples were treated with EndoH or left untreated prior to electrophoretic separation. EndoH sensitive proteins are indicated by asterisks. E) Sub-cellular localization of C- and N-terminal FLAG fusions of MPXV197 was determined by IFA using αFLAG. CHO cells were either permeabilized (‘Intracellular’) or non-permeabilized (‘Cell-surface’) prior to IFA. Scale bar is 20 µm. Arrows indicate the plasma membrane.
Figure 3
Figure 3. MPXV197 inhibits TCR-dependent T cell stimulation.
A) CM9-specific CD8+ T-cells were incubated (18 h) with untreated CHO cells (UN) or CHO cells transduced with either Ad-197/Ad-tTA (‘Ad-197’) or Ad-tTA only (‘Ad-control’) and stimulated with CM9-peptide pulsed BLCLs. The percentage of INFγ+ TNFα+ CD8+ T-cells was determined by ICCS. B) To determine the kinetics of T cell inhibition by MPXV197 CM9-specific T-cells were incubated with Ad-197/Ad-tTA or Ad-tTA-transduced CHO cells for indicated time periods, washed, and stimulated with peptide pulsed BLCLs. C) Human Mtb specific CD8+ T cell clones D466 D6 and D160 1–23 were stimulated with BEAS-2b cells transduced with Ad-197/Ad-tTA or Ad-tTA only in the presence of CFP102-12 peptide or pronase digested Mtb cell wall, respectively. For MHC-independent stimulation, both clones were incubated with PHA. The number of IFNγ+ T cells was measured by ELISPOT. D) CM9-specific CD8+ T cells were incubated (18 h) with CHO cells transduced with Ad-197/Ad-tTA or Ad-tTA, washed, and stimulated either with PMA/Iono or CM9-peptide pulsed BLCLs. Left panel: The percentages of INFγ+ TNFα+ T-cells were determined by ICCS with stimulation in the presence of uninfected CHO cells set to 100% (MAX). Right Panel: The percent live CD8+ T cells was determined by LIVE/DEAD Fixable Dead Cell Stain. E) MaMu-A*01/CM9 tetramer staining of CM9-pecific CD8+ T cells after 18 h of incubation with MPXV197-expressing CHO cells (‘Ad-197’) or control cells (‘Ad-control’).
Figure 4
Figure 4. Inhibition of T cell activation by VARV B22.
A) Sequence comparison of MPXV 197 and its orthologs by Geneious v5.6.3. Black, green, and red bars show consensus sequence, conserved, and hydrophobic residues, respectively. B) CHO cells were transduced with Ad-B22R, Ad-197 and Ad-tTA for 24 h followed by immunoblotting with αFLAG. Right panel: Overexposure reveals a >250 kDa band (asterisk). C) CHO cells were transduced as in B). After 24 h, cell surface proteins were biotinylated followed by immunoprecipitation with NeutrAvidin, electrophoretic separation and immunoblotting with αFLAG. D) CHO cells were transfected with pCDNA3.1-B22-CFlag (24 h), fixed, and either permeabilized (‘intracellular’) or left unpermeabilized (‘cell-surface’). The samples were stained with αFLAG and analyzed by LSCM. The scale bar is 20 µm. E) BEAS-2b cells, uninfected (UN) or transduced with Ad-197/Ad-tTA (‘Ad-197’) or Ad-tTA only (‘Ad-control’) were used to stimulate human Mtb-specific T cell clone D466 D6 with CFP102-12 peptide. F) CM9-specific T-cells were incubated (18 h) with CHO cells either uninfected (UN) or transduced with Ad-B22R/Ad-tTA (‘Ad-B22R’) or Ad-tTA only (‘Ad-control’) followed by stimulation with CM9-peptide pulsed BLCLs.
Figure 5
Figure 5. Inhibition of T cell activation by CPXV 219 is species-specific.
A) Human Mtb-specific T cell clone D466 D6 was incubated with BEAS-2b cells uninfected (UN) or infected with VACV or VACV-219 (3 h) prior to addition of CFP102-12 peptide. The number of IFNγ+ T cells was determined by ELISPOT. B) CM9-specific T-cells were incubated with HFF infected with VACV or VACV-219 for 18 h and stimulated with CM9-peptide pulsed BLCLs. The percentage of INFγ+ TNFα+ CD8+ T cells was determined by ICCS. C) PBMC from VACV-immune subjects (n = 3) were infected with indicated viruses (optimized MOI of 0.3-0.6) for 18 h. The infection rates for CD14+ cells were VACV (54%), CPXV (45%), CPXV Δ12Δ203-221 (51%), CPXVΔ12-203 (60%), CPXVΔ11-38 (72%), and CPXVΔ204-221 (73%). The percentage of CD4+ and CD8+ responding to poxvirus infection was determined by ICCS for IFNγ and TNFα. The frequency of VACV-reactive T cells was set to 100%. D) Splenocytes from VACV-immunized mice were incubated with A20 cells infected with indicated viruses (MOI 5.0) for 6 h. The frequency of poxvirus-reactive T cells was determined by ICCS for IFNγ and TNFα relative to the frequency of VACV-reactive T cells which was set to 100%. E) Biosynthesis of CPXV219 was studied in human 143 cells infected with CPXV wild-type or Δ219 mutant (3 h) and metabolically labeled for 45 min followed by chase for 0.5, 1, and 3 h. Cell lysates were immunoprecipitated with αCPXV219 Ab. F) Left Panel: Immunoblot of CHO cells infected with CPXV, CPXVΔ219 (MOI = 5.0) or uninfected (UN) using αCPXV219 Ab. Right Panel: Immunoblot with αCPXV219 Ab of CHO cells infected with VACV, VACV-219 (MOI = 5.0) or uninfected (UN), or co-infected with T7-polymerase expressing VACV VTF7-3 (MOI = 5.0).
Figure 6
Figure 6. MPXVΔ197 is attenuated in vivo.
A) 4 female RM were inoculated i.b. with 2×10⁵ PFU of MPXV US2003 (WT) or MPXVΔ197 on day 0. Whole blood, BAL, and PBMC samples were taken on indicated dpi. 2 RM infected with MPXVUS2003, WT-4 and WT-3, were euthanized at 12 and 24 dpi, respectively. The remaining WT-infected were euthanized on days 37 and 38 pi. Animals infected with MPXVΔ197 were euthanized at 41 and 42 dpi. B) Average nighttime body temperature (7PM to 7AM) as determined by biotelemetry transmitters for RM infected with WT (black) or MPXVΔ197 (red) (mean +/− SEM). P = 0.0007 (area under curve (AUC), F-test). C) and D) Viral loads determined by qPCR in BAL (C) and whole blood (D) of WT (blue) or MPXVΔ197 (red)-infected RM. P = 0.003 (AUC, F-test) and P<0.0001 (AUC, F-test) for BAL and whole blood, respectively. E) Number of skin lesions in WT (blue) or MPXVΔ197 (red)-infected RM. The p-value for the AUC comparison is P = 0.0003 (F-test). F) Poxvirus-specific antibody titers were determined by ELISA using VACV as antigen. The titers were not statistically different between WT and MPXVΔ197 cohorts.
Figure 7
Figure 7. MPXV197 suppresses T cell responses in vivo.
A) PBMC from WT (blue) and MPXVΔ197 (red)-infected RM were infected with VACV (MOI of 0.3) for 18 h. The background-subtracted frequency of poxvirus-responsive CD4+ and CD8+ T cells was determined by ICCS for TNFα and IFNγ. The differences were statistically significant at day 21 (P = 0.0063, F-test) for CD4+ T cells and at day 14 (P = 0.0069, F-test) for CD8+ T cells. B) The total frequency of CD4+ and CD8+ relative to day 0 as determined by flow cytometry is shown. The frequencies were not statistically different between WT and MPXVΔ197 cohorts. C) The percentage of CD4+ and CD8+ T cells relative to day 0 responding to anti-CD3 stimulation was determined by ICCS for IFNγ and TNFα. PBMC from WT (blue) or MPXVΔ197 (red) infected animals were stimulated with plate-bound αCD3 Ab for 6 h. The differences were statistically significant at day 14 (P = 0.0065, two-tailed t-test) for CD8+ T cells.

References

    1. Gross E (2003) Update on emerging infections: news from the Centers for Disease Control and prevention. Update: Multistate outbreak of monkeypox–Illinois, Indiana, Kansas, Missouri, Ohio, and Wisconsin, 2003. Ann Emerg Med 42: 660–662 discussion 662–664. - PMC - PubMed
    1. Likos AM, Sammons SA, Olson VA, Frace AM, Li Y, et al. (2005) A tale of two clades: monkeypox viruses. J Gen Virol 86: 2661–2672. - PubMed
    1. Chen N, Li G, Liszewski MK, Atkinson JP, Jahrling PB, et al. (2005) Virulence differences between monkeypox virus isolates from West Africa and the Congo basin. Virology 340: 46–63. - PMC - PubMed
    1. Hutson CL, Olson VA, Carroll DS, Abel JA, Hughes CM, et al. (2009) A prairie dog animal model of systemic orthopoxvirus disease using West African and Congo Basin strains of monkeypox virus. J Gen Virol 90: 323–333. - PubMed
    1. Sbrana E, Xiao SY, Newman PC, Tesh RB (2007) Comparative pathology of North American and central African strains of monkeypox virus in a ground squirrel model of the disease. Am J Trop Med Hyg 76: 155–164. - PubMed

Publication types

MeSH terms