

Freezing-induced perturbation of tertiary structure of a monoclonal antibody
- PMID: 24832730
- PMCID: PMC4069245
- DOI: 10.1002/jps.24013
Freezing-induced perturbation of tertiary structure of a monoclonal antibody
Abstract
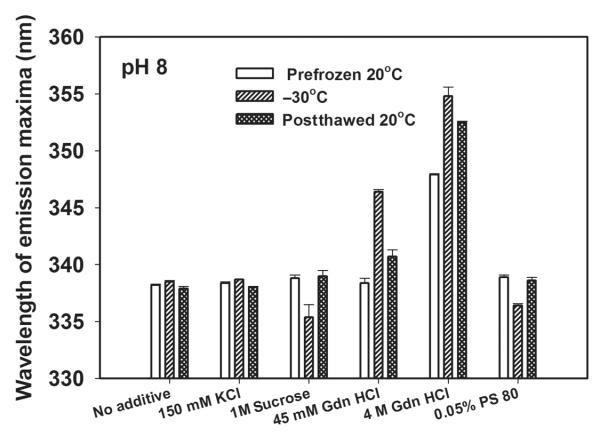
We studied the effects of pH and solution additives on freezing-induced perturbations in the tertiary structure of a monoclonal antibody (mAb) by intrinsic tryptophan fluorescence spectroscopy. In general, freezing caused perturbations in the tertiary structure of the mAb, which were reversible or irreversible depending on the pH or excipients present in the formulation. Protein aggregation occurred in freeze-thawed samples in which perturbations of the tertiary structure were observed, but the levels of protein aggregates formed were not proportional to the degree of structural perturbation. Protein aggregation also occurred in freeze-thawed samples without obvious structural perturbations, most likely because of freeze concentration of protein and salts, and thus reduced protein colloidal stability. Therefore, freezing-induced protein aggregation may or may not first involve the perturbation of its native structure, followed by the assembly processes to form aggregates. Depending on the solution conditions, either step can be rate limiting. Finally, this study demonstrates the potential of fluorescence spectroscopy as a valuable tool for screening therapeutic protein formulations subjected to freeze-thaw stress.
Keywords: excipients; formulation; liquid chromatography; monoclonal antibody; protein aggregation; proteins; stability; surfactants.
© 2014 Wiley Periodicals, Inc. and the American Pharmacists Association.
Figures


References
-
- Manning MC, Patel K, Borchardt RT. Stability of protein pharmaceuticals. Pharm Res. 1989;6(11):903–918. - PubMed
-
- Carpenter JF, Pikal MJ, Chang BS, Randolph TW. Rational design of stable lyophilized protein formulations: Some practical advice. Pharm Res. 1997;14(8):969–975. - PubMed
-
- Kerwin BA, Heller MC, Levin SH, Randolph TW. Effects of Tween 80 and sucrose on acute short-term stability and long-term storage at −20 degrees C of a recombinant hemoglobin. J Pharm Sci. 1998;87(9):1062–1068. - PubMed
-
- Rumsey SC, Galeano NF, Arad Y, Deckelbaum RJ. Cryopreservation with sucrose maintains normal physical and biological properties of human plasma low density lipoproteins. J Lipid Res. 1992;33(10):1551–1561. - PubMed
-
- Carpenter JF, Crowe JH. The mechanism of cryoprotection of proteins by solutes. Cryobiology. 1988;25(3):244–255. - PubMed
Publication types
MeSH terms
Substances
Grants and funding
LinkOut - more resources
Full Text Sources
Other Literature Sources
