

The role of DNA damage and repair in decitabine-mediated apoptosis in multiple myeloma
- PMID: 24833108
- PMCID: PMC4102796
- DOI: 10.18632/oncotarget.1821
The role of DNA damage and repair in decitabine-mediated apoptosis in multiple myeloma
Abstract
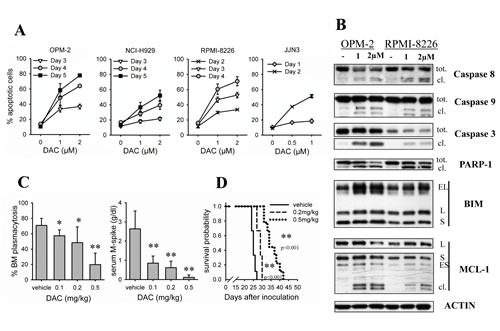
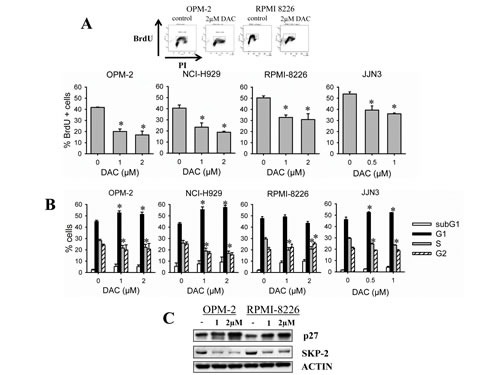
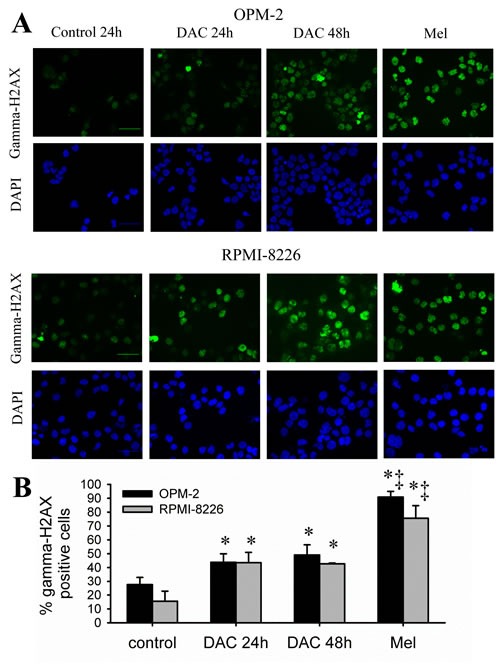
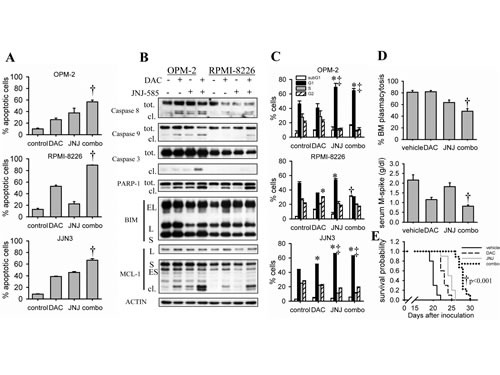
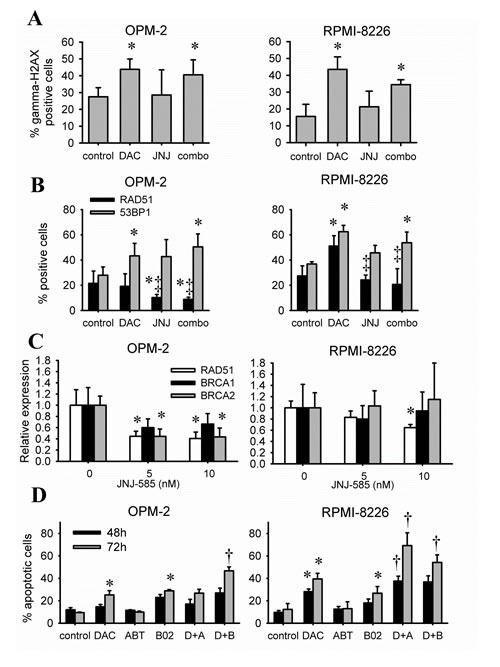
DNA methyltransferase inhibitors (DNMTi) and histone deacetylase inhibitors (HDACi) are under investigation for the treatment of cancer, including the plasma cell malignancy multiple myeloma (MM). Evidence exists that DNA damage and repair contribute to the cytotoxicity mediated by the DNMTi decitabine. Here, we investigated the DNA damage response (DDR) induced by decitabine in MM using 4 human MM cell lines and the murine 5T33MM model. In addition, we explored how the HDACi JNJ-26481585 affects this DDR. Decitabine induced DNA damage (gamma-H2AX foci formation), followed by a G0/G1- or G2/M-phase arrest and caspase-mediated apoptosis. JNJ-26481585 enhanced the anti-MM effect of decitabine both in vitro and in vivo. As JNJ-26481585 did not enhance decitabine-mediated gamma-H2AX foci formation, we investigated the DNA repair response towards decitabine and/or JNJ-26481585. Decitabine augmented RAD51 foci formation (marker for homologous recombination (HR)) and/or 53BP1 foci formation (marker for non-homologous end joining (NHEJ)). Interestingly, JNJ-26481585 negatively affected basal or decitabine-induced RAD51 foci formation. Finally, B02 (RAD51 inhibitor) enhanced decitabine-mediated apoptosis. Together, we report that decitabine-induced DNA damage stimulates HR and/or NHEJ. JNJ-26481585 negatively affects RAD51 foci formation, thereby providing an additional explanation for the combinatory effect between decitabine and JNJ-26481585.
Conflict of interest statement
Steve Mcclue works for Janssen, Pharmaceutical Companies of Johnson & Johnson. The other authors declare no potential conflict of interest.
Figures
Similar articles
-
Preclinical anti-myeloma activity of EDO-S101, a new bendamustine-derived molecule with added HDACi activity, through potent DNA damage induction and impairment of DNA repair.J Hematol Oncol. 2017 Jun 20;10(1):127. doi: 10.1186/s13045-017-0495-y. J Hematol Oncol. 2017. PMID: 28633670 Free PMC article.
-
In vivo treatment with epigenetic modulating agents induces transcriptional alterations associated with prognosis and immunomodulation in multiple myeloma.Oncotarget. 2015 Feb 20;6(5):3319-34. doi: 10.18632/oncotarget.3207. Oncotarget. 2015. PMID: 25669970 Free PMC article.
-
The effects of JNJ-26481585, a novel hydroxamate-based histone deacetylase inhibitor, on the development of multiple myeloma in the 5T2MM and 5T33MM murine models.Leukemia. 2009 Oct;23(10):1894-903. doi: 10.1038/leu.2009.121. Epub 2009 Jun 4. Leukemia. 2009. PMID: 19494837
-
Preclinical antileukemia activity of JNJ-26481585, a potent second-generation histone deacetylase inhibitor.Leuk Res. 2010 Feb;34(2):221-8. doi: 10.1016/j.leukres.2009.07.024. Epub 2009 Aug 13. Leuk Res. 2010. PMID: 19682743
-
The Interplay between the DNA Damage Response (DDR) Network and the Mitogen-Activated Protein Kinase (MAPK) Signaling Pathway in Multiple Myeloma.Int J Mol Sci. 2024 Jun 26;25(13):6991. doi: 10.3390/ijms25136991. Int J Mol Sci. 2024. PMID: 39000097 Free PMC article. Review.
Cited by
-
CHK1 and RAD51 activation after DNA damage is regulated via urokinase receptor/TLR4 signaling.Cell Death Dis. 2016 Sep 29;7(9):e2383. doi: 10.1038/cddis.2016.291. Cell Death Dis. 2016. PMID: 27685627 Free PMC article.
-
Epigenetic treatment of multiple myeloma mediates tumor intrinsic and extrinsic immunomodulatory effects.Oncoimmunology. 2018 Jul 23;7(10):e1484981. doi: 10.1080/2162402X.2018.1484981. eCollection 2018. Oncoimmunology. 2018. PMID: 30288346 Free PMC article.
-
DNA damage, demethylation and anticancer activity of DNA methyltransferase (DNMT) inhibitors.Sci Rep. 2023 Apr 12;13(1):5964. doi: 10.1038/s41598-023-32509-4. Sci Rep. 2023. PMID: 37045940 Free PMC article.
-
The Role of Epigenetics in the Development and Progression of Multiple Myeloma.Biomedicines. 2022 Oct 31;10(11):2767. doi: 10.3390/biomedicines10112767. Biomedicines. 2022. PMID: 36359286 Free PMC article. Review.
-
Decitabine attenuates nociceptive behavior in a murine model of bone cancer pain.Pain. 2019 Mar;160(3):619-631. doi: 10.1097/j.pain.0000000000001442. Pain. 2019. PMID: 30422869 Free PMC article.
References
-
- Mahindra A, Hideshima T, Anderson KC. Multiple myeloma: biology of the disease. Blood Rev. 2011;24(1):S5–11. - PubMed
-
- Engelhardt M, Terpos E, Kleber M, Gay F, Wasch R, Morgan G, Cavo M, van de Donk N, Beilhack A, Bruno B, Johnsen HE, Hajek R, Driessen C, et al. European Myeloma Network recommendations on the evaluation and treatment of newly diagnosed patients with multiple myeloma. Haematologica. 2014;99:232–242. - PMC - PubMed
-
- Facon T, Mary JY, Hulin C, Benboubker L, Attal M, Pegourie B, Renaud M, Harousseau JL, Guillerm G, Chaleteix C, Dib M, Voillat L, Maisonneuve H, et al. Melphalan and prednisone plus thalidomide versus melphalan and prednisone alone or reduced-intensity autologous stem cell transplantation in elderly patients with multiple myeloma (IFM 99-06): a randomised trial. Lancet. 2007;370:1209–1218. - PubMed
-
- Harousseau JL, Attal M, Avet-Loiseau H, Marit G, Caillot D, Mohty M, Lenain P, Hulin C, Facon T, Casassus P, Michallet M, Maisonneuve H, Benboubker L, et al. Bortezomib plus dexamethasone is superior to vincristine plus doxorubicin plus dexamethasone as induction treatment prior to autologous stem-cell transplantation in newly diagnosed multiple myeloma: results of the IFM 2005-01 phase III trial. J Clin Oncol. 2010;28:4621–4629. - PubMed
-
- Leleu X, Attal M, Arnulf B, Moreau P, Traulle C, Marit G, Mathiot C, Petillon MO, Macro M, Roussel M, Pegourie B, Kolb B, Stoppa AM, et al. Pomalidomide plus low-dose dexamethasone is active and well tolerated in bortezomib and lenalidomide-refractory multiple myeloma: Intergroupe Francophone du Myelome 2009-02. Blood. 2013;121:1968–1975. - PubMed
Publication types
MeSH terms
Substances
LinkOut - more resources
Full Text Sources
Other Literature Sources
Medical
Research Materials
