

Application of fluorescence two-dimensional difference in-gel electrophoresis as a proteomic biomarker discovery tool in muscular dystrophy research
- PMID: 24833232
- PMCID: PMC4009800
- DOI: 10.3390/biology2041438
Application of fluorescence two-dimensional difference in-gel electrophoresis as a proteomic biomarker discovery tool in muscular dystrophy research
Abstract
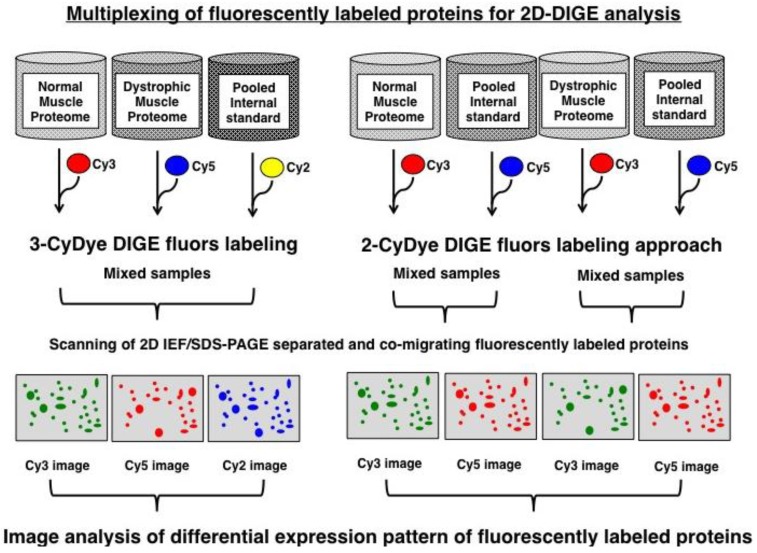
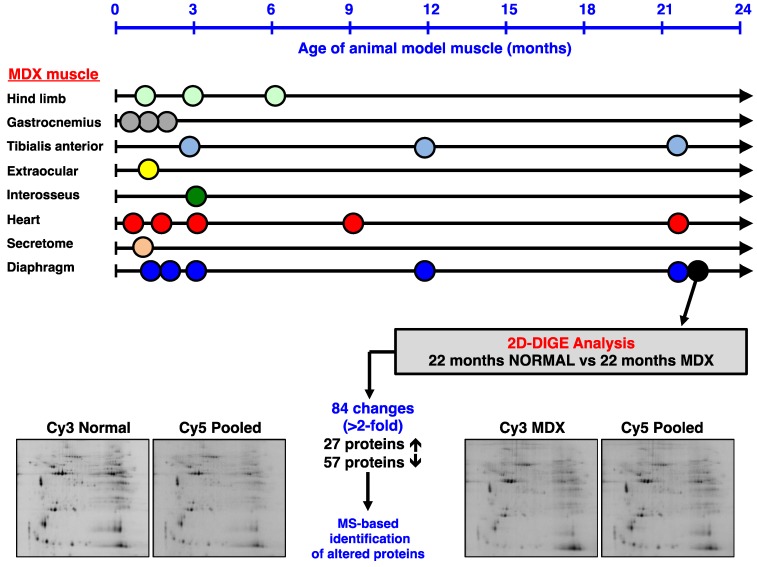
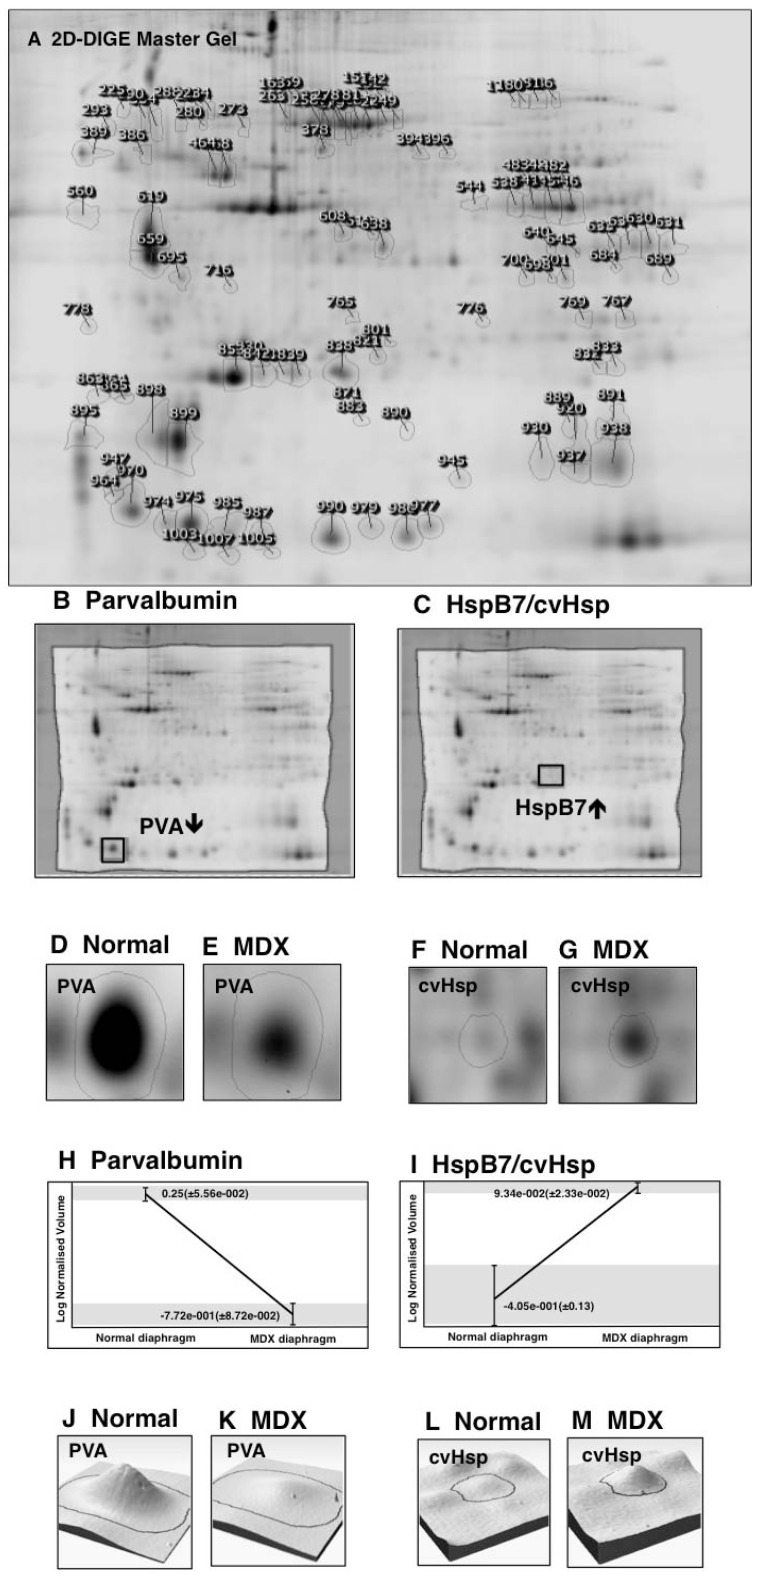
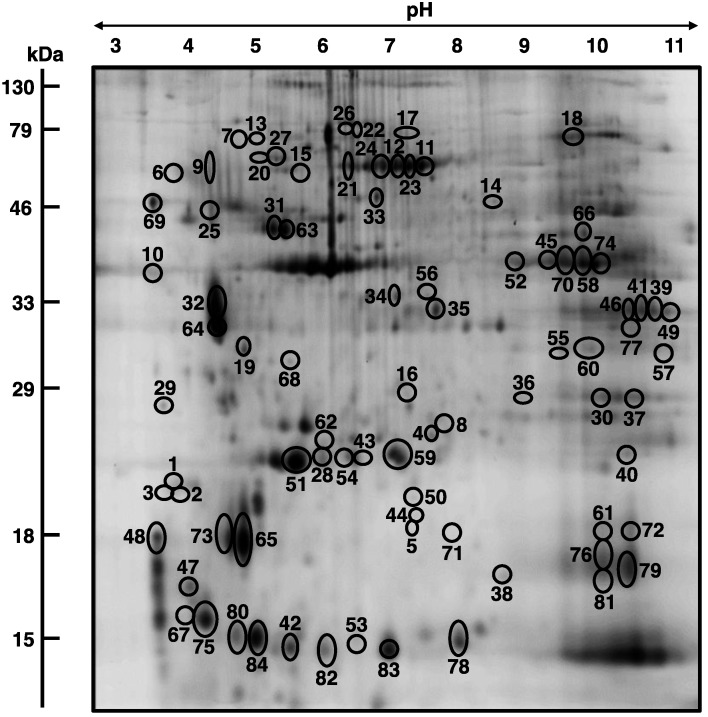
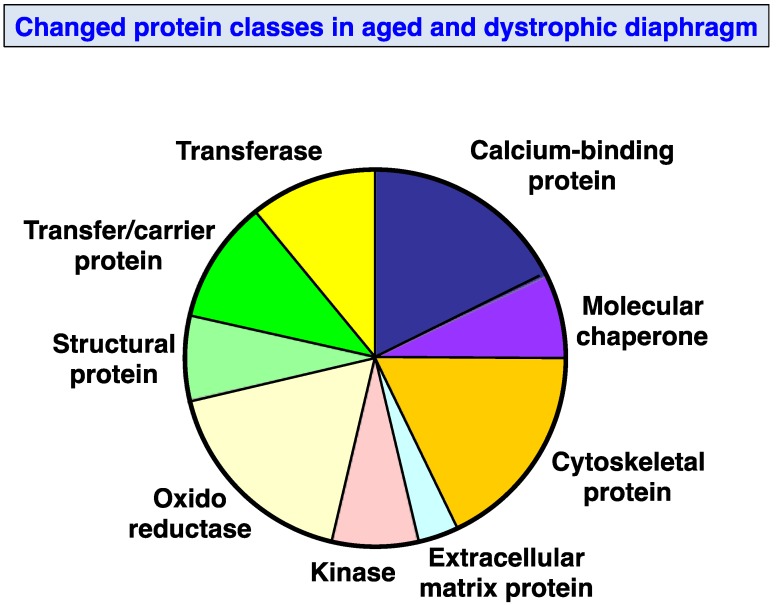
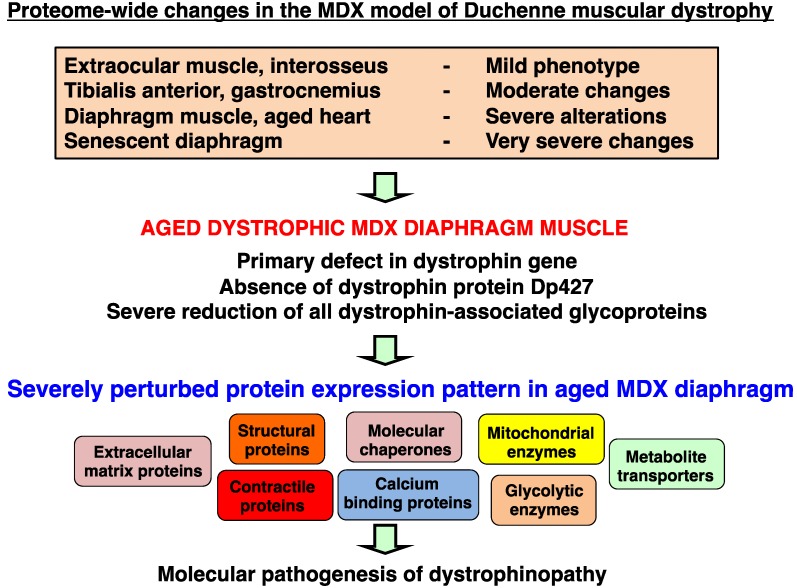
In this article, we illustrate the application of difference in-gel electrophoresis for the proteomic analysis of dystrophic skeletal muscle. The mdx diaphragm was used as a tissue model of dystrophinopathy. Two-dimensional gel electrophoresis is a widely employed protein separation method in proteomic investigations. Although two-dimensional gels usually underestimate the cellular presence of very high molecular mass proteins, integral membrane proteins and low copy number proteins, this method is extremely powerful in the comprehensive analysis of contractile proteins, metabolic enzymes, structural proteins and molecular chaperones. This gives rise to two-dimensional gel electrophoretic separation as the method of choice for studying contractile tissues in health and disease. For comparative studies, fluorescence difference in-gel electrophoresis has been shown to provide an excellent biomarker discovery tool. Since aged diaphragm fibres from the mdx mouse model of Duchenne muscular dystrophy closely resemble the human pathology, we have carried out a mass spectrometry-based comparison of the naturally aged diaphragm versus the senescent dystrophic diaphragm. The proteomic comparison of wild type versus mdx diaphragm resulted in the identification of 84 altered protein species. Novel molecular insights into dystrophic changes suggest increased cellular stress, impaired calcium buffering, cytostructural alterations and disturbances of mitochondrial metabolism in dystrophin-deficient muscle tissue.
Figures
Similar articles
-
Proteomic analysis of dystrophin deficiency and associated changes in the aged mdx-4cv heart model of dystrophinopathy-related cardiomyopathy.J Proteomics. 2016 Aug 11;145:24-36. doi: 10.1016/j.jprot.2016.03.011. Epub 2016 Mar 4. J Proteomics. 2016. PMID: 26961938
-
Comparative proteomic profiling of soleus, extensor digitorum longus, flexor digitorum brevis and interosseus muscles from the mdx mouse model of Duchenne muscular dystrophy.Int J Mol Med. 2013 Sep;32(3):544-56. doi: 10.3892/ijmm.2013.1429. Epub 2013 Jul 3. Int J Mol Med. 2013. PMID: 23828267 Free PMC article.
-
Proteomic profiling of the mouse diaphragm and refined mass spectrometric analysis of the dystrophic phenotype.J Muscle Res Cell Motil. 2019 Mar;40(1):9-28. doi: 10.1007/s10974-019-09507-z. Epub 2019 Mar 19. J Muscle Res Cell Motil. 2019. PMID: 30888583
-
Proteomic profiling of x-linked muscular dystrophy.J Muscle Res Cell Motil. 2009 Dec;30(7-8):267-9. doi: 10.1007/s10974-009-9197-6. J Muscle Res Cell Motil. 2009. PMID: 20082121 Review.
-
Proteomic profiling of the dystrophin-deficient mdx phenocopy of dystrophinopathy-associated cardiomyopathy.Biomed Res Int. 2014;2014:246195. doi: 10.1155/2014/246195. Epub 2014 Mar 20. Biomed Res Int. 2014. PMID: 24772416 Free PMC article. Review.
Cited by
-
Comparative Label-Free Mass Spectrometric Analysis of Mildly versus Severely Affected mdx Mouse Skeletal Muscles Identifies Annexin, Lamin, and Vimentin as Universal Dystrophic Markers.Molecules. 2015 Jun 19;20(6):11317-44. doi: 10.3390/molecules200611317. Molecules. 2015. PMID: 26102067 Free PMC article.
-
Histopathology of Duchenne muscular dystrophy in correlation with changes in proteomic biomarkers.Histol Histopathol. 2022 Feb;37(2):101-116. doi: 10.14670/HH-18-403. Epub 2021 Dec 7. Histol Histopathol. 2022. PMID: 34873679 Review.
-
Proteomic profiling of impaired excitation-contraction coupling and abnormal calcium handling in muscular dystrophy.Proteomics. 2022 Dec;22(23-24):e2200003. doi: 10.1002/pmic.202200003. Epub 2022 Aug 8. Proteomics. 2022. PMID: 35902360 Free PMC article. Review.
-
Characterization of Contractile Proteins from Skeletal Muscle Using Gel-Based Top-Down Proteomics.Proteomes. 2019 Jun 20;7(2):25. doi: 10.3390/proteomes7020025. Proteomes. 2019. PMID: 31226838 Free PMC article. Review.
-
Comparative Skeletal Muscle Proteomics Using Two-Dimensional Gel Electrophoresis.Proteomes. 2016 Sep 9;4(3):27. doi: 10.3390/proteomes4030027. Proteomes. 2016. PMID: 28248237 Free PMC article. Review.
References
LinkOut - more resources
Full Text Sources
Other Literature Sources
