. 2014 Aug;350(2):243-56.
doi: 10.1124/jpet.113.212076. Epub 2014 May 15.

Blocking sirtuin 1 and 2 inhibits renal interstitial fibroblast activation and attenuates renal interstitial fibrosis in obstructive nephropathy

Affiliations

Blocking sirtuin 1 and 2 inhibits renal interstitial fibroblast activation and attenuates renal interstitial fibrosis in obstructive nephropathy

Murugavel Ponnusamy et al. J Pharmacol Exp Ther. 2014 Aug.

Abstract

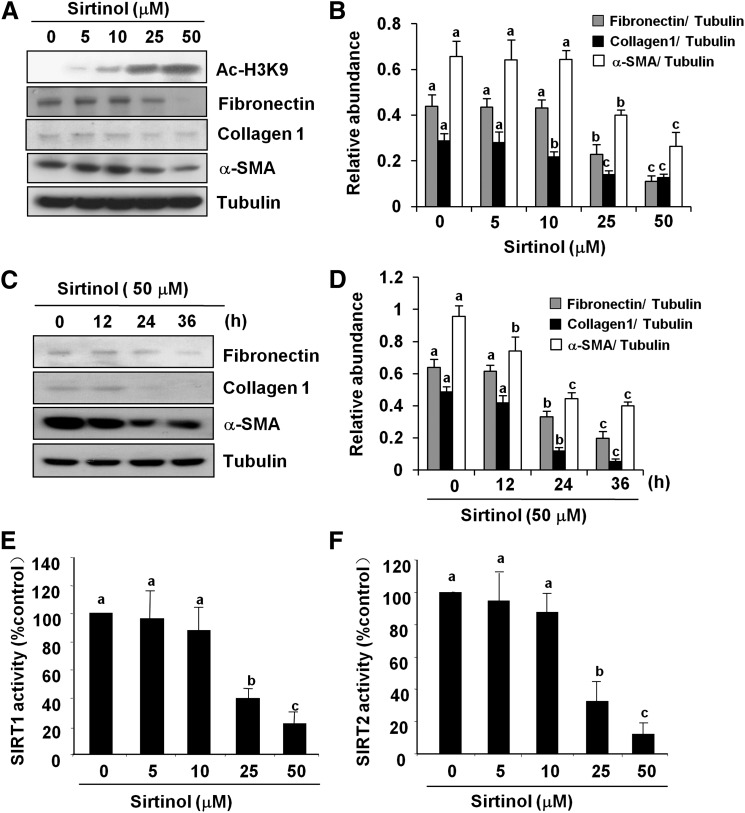
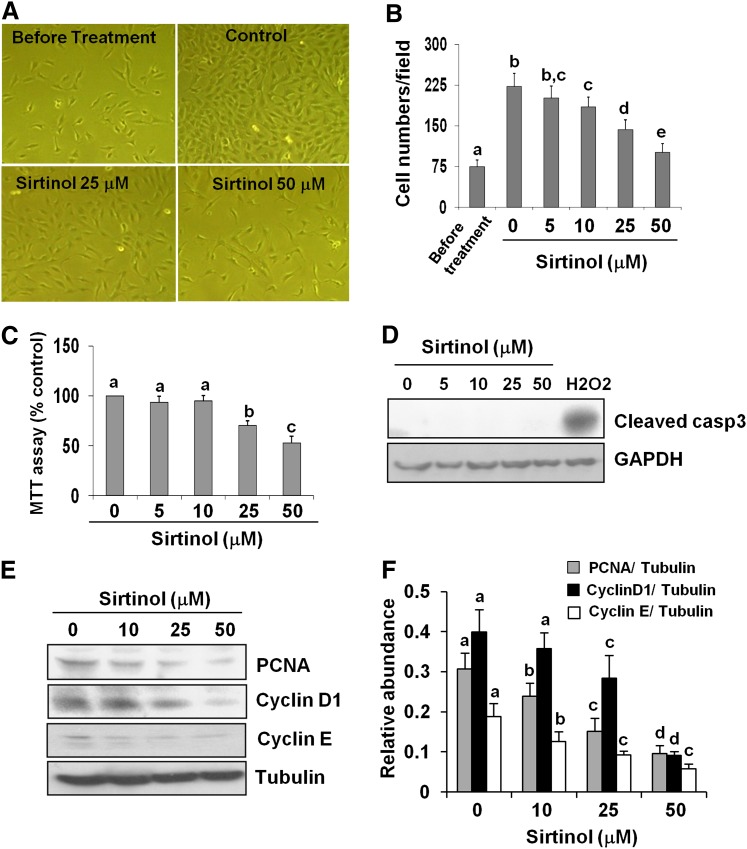
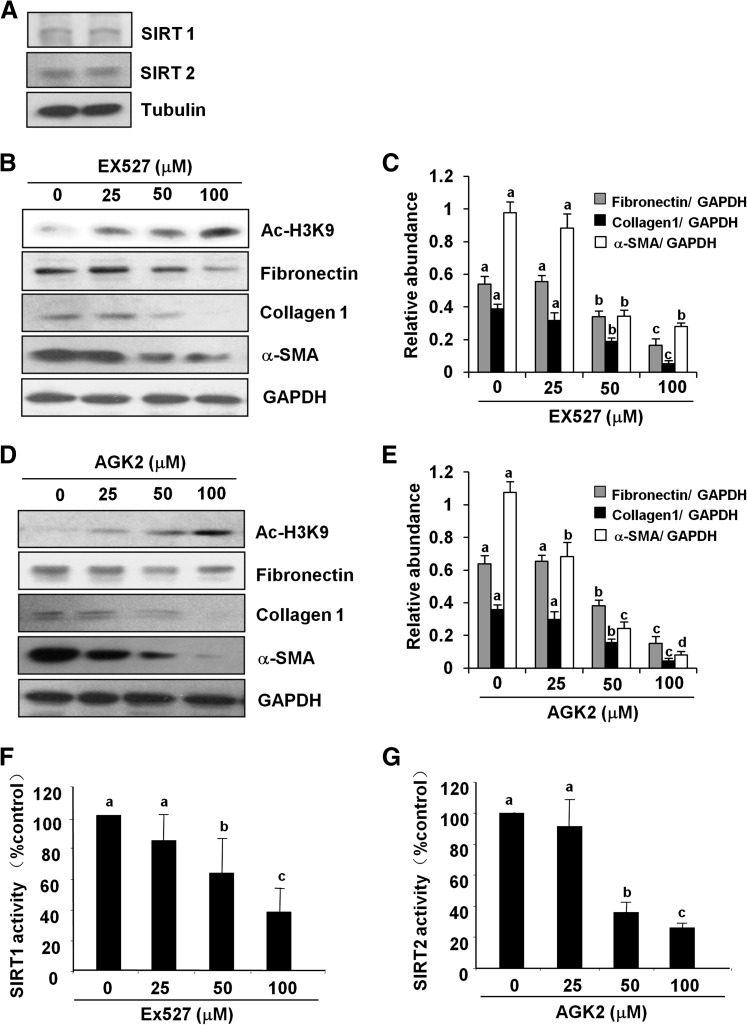
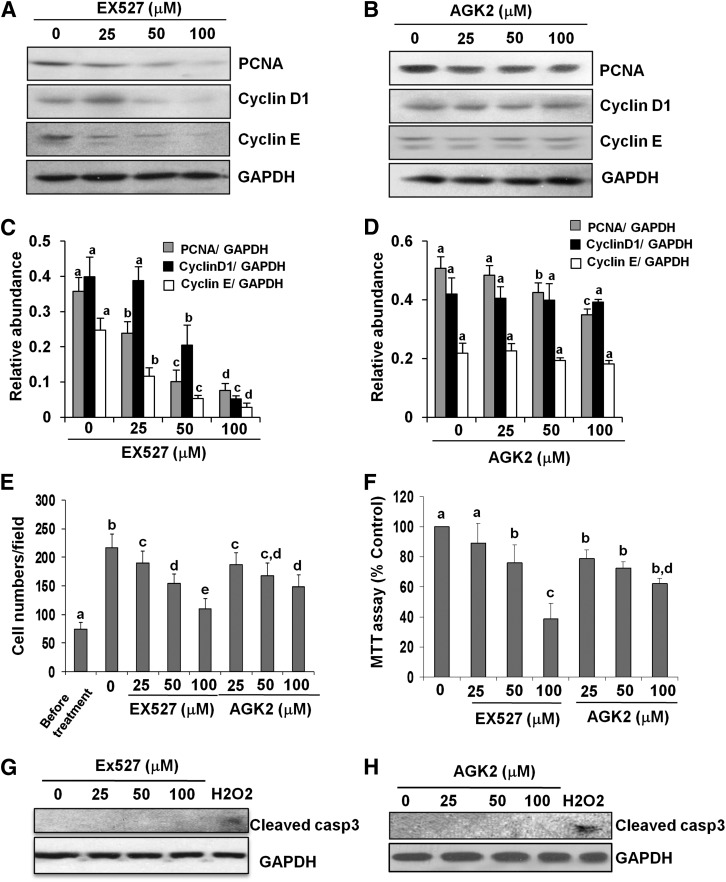
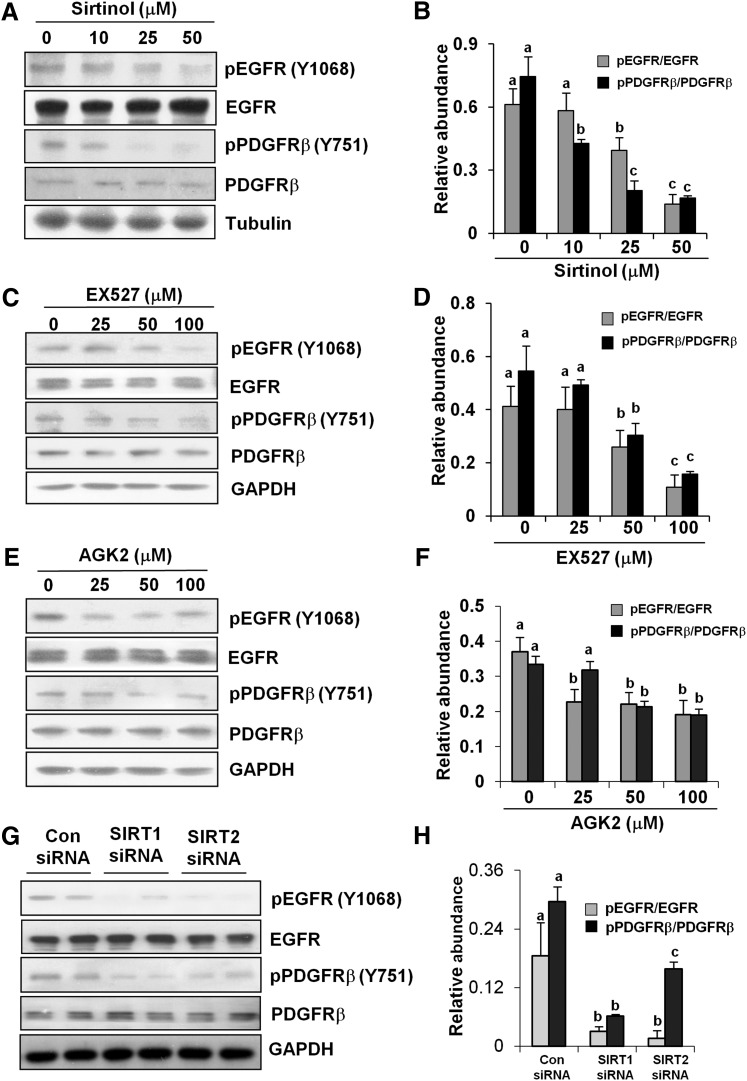
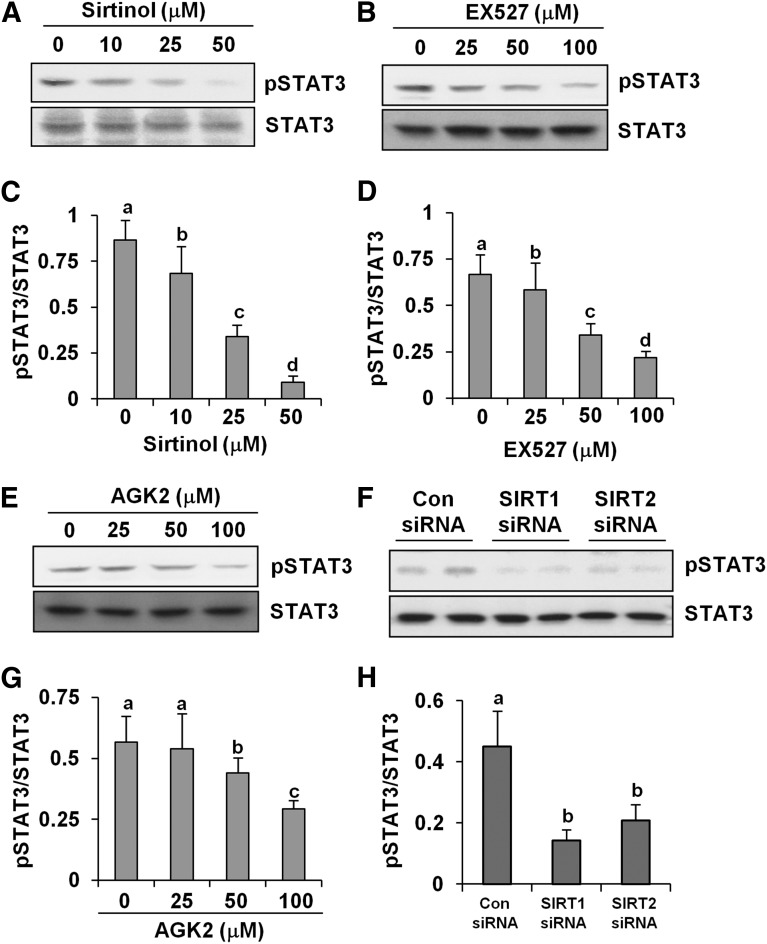
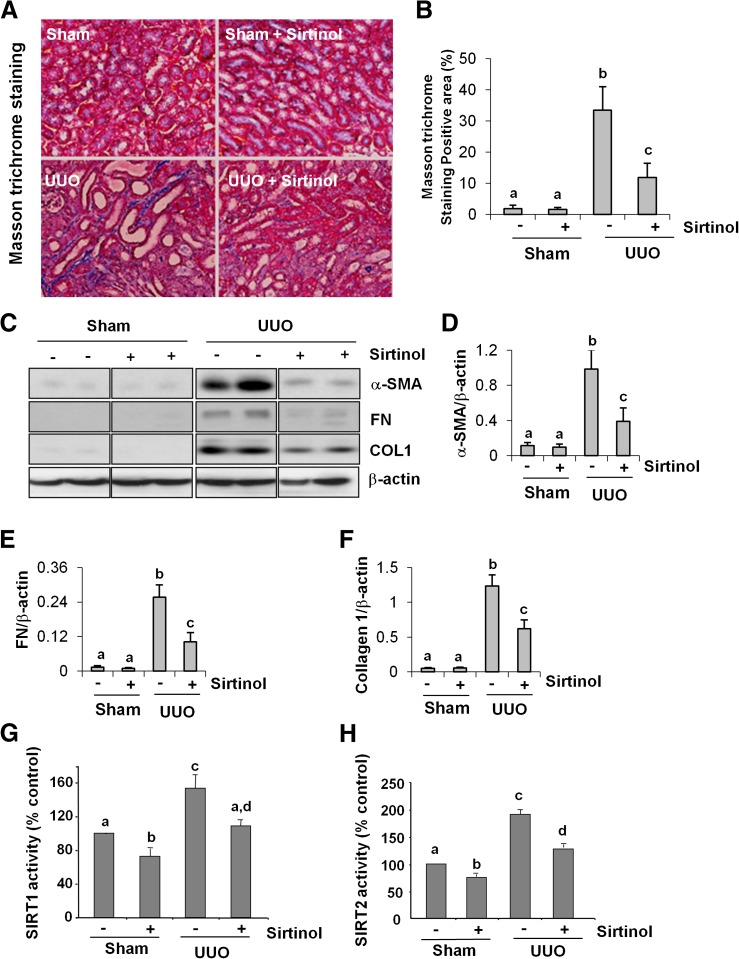
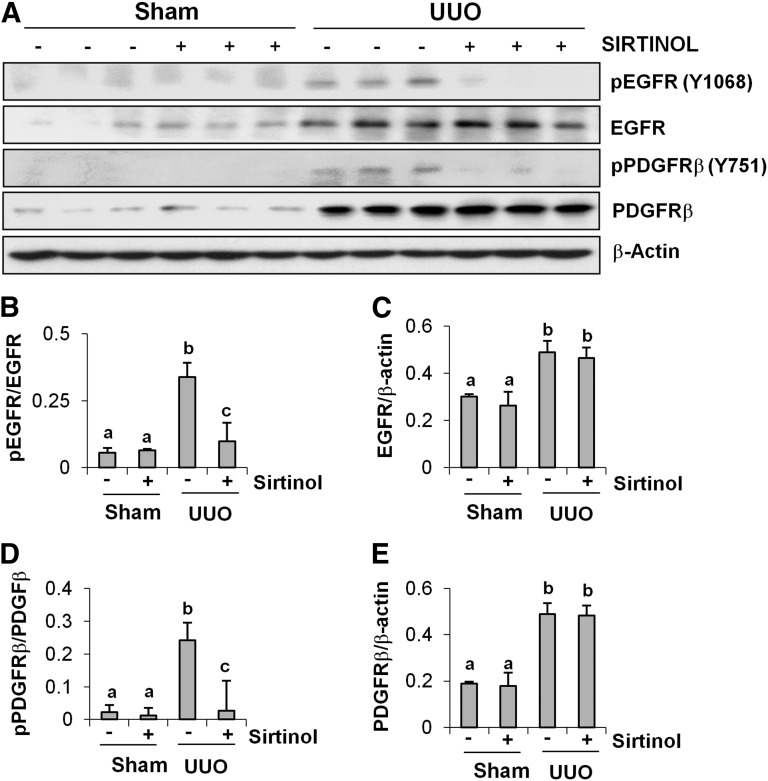
Our recent studies revealed that blocking class I/II histone deacetylases (HDACs) inhibits renal interstitial fibroblast activation and proliferation and alleviates development of renal fibrosis. However, the effect of class III HDAC, particularly sirtuin 1 and 2 (SIRT1 and SIRT2), inhibition on renal fibrogenesis remains elusive. Here, we demonstrate that both SIRT1 and SIRT2 were expressed in cultured renal interstitial fibroblasts (NRK-49F). Exposure of NRK-49F to sirtinol, a selective inhibitor of SIRT1/2, or EX527 (6-chloro-2,3,4,9-tetrahydro-1H-carbazole-1-carboxamide), an inhibitor for SIRT1, resulted in reduced expression of fibroblast activation markers (α-smooth muscle actin, fibronectin, and collagen I) as well as proliferation markers (proliferating cell nuclear antigen, cyclin D1, cyclin E) in dose- and time-dependent manners. Treatment with a SIRT2 inhibitor, AGK2 (2-cyano-3-[5-(2,5-dichlorophenyl)-2-furanyl]-N-5-quinolinyl-2-propenamide), also dose- and time-dependently inhibited renal fibroblast activation and, to a lesser extent, cell proliferation. Furthermore, silencing of either SIRT1 or SIRT2 by small interfering RNA exhibited similar inhibitory effects. In a mouse model of obstructive nephropathy, administration of sirtinol attenuated deposition of collagen fibrils as well as reduced expression of α-smooth muscle actin, collagen I, and fibronectin in the injured kidney. SIRT1/2 inhibition-mediated antifibrotic effects are associated with dephosphorylation of epidermal growth factor receptor (EGFR), platelet-derived growth factor receptor-β (PDGFRβ), and signal transducer and activator of transcription 3. Thus, SIRT1/2 activity may contribute to renal fibroblast activation and proliferation as well as renal fibrogenesis through activation of at least EGFR and PDGFRβ signaling. Blocking SIRT1/2 activation may have therapeutic potential for the treatment of chronic kidney disease.


Figures

Fig. 1.
Fig. 1.
Sirtinol inhibits renal fibroblast activation. Normally cultured NRK-49F cells were treated with sirtinol (0–50 μM) for 36 hours (A and B) or treated with 50 μM sirtinol for the indicated time (C and D). Then, cell lysates were prepared and subjected to immunoblot analysis with antibodies for acetyl-H3K9 (Ac-H3K9), α-SMA, collagen I, fibronectin, or α-tubulin. Representative immunoblots from three or more experiments are shown (A and C). The levels of α-SMA, collagen I, and fibronectin were quantified by densitometry and normalized with α-tubulin (B and D). The activity of SIRT1 and SIRT2 in fibroblasts treated with sirtinol was measured by an enzymatic assay kit with fluorescence-labeled acetylated peptide as substrate. The value was expressed as the percentages of inhibition in each sample relative to controls (E and F). Values are the means ± S.D. of three independent experiments. Bars with different letters (a–c) are significantly different from one another (P < 0.01).
Fig. 2.
Fig. 2.
Sirtinol inhibits renal fibroblast proliferation. NRK-49F cells were cultured in medium with 5% fetal bovine serum and treated with sirtinol (0–50 μM) for 36 hours (A–E). Cells were randomly photographed in bright field (200×) (A) and cell proliferation was measured by counting cell number (B) or the MTT assay (C). To measure cell death, cultured NRK-49F cells were exposed to the same concentrations (0–50 μM) of sirtinol for 48 hours or treated with 1 mM H2O2 for 3 hours as positive control. Cell lysates were subjected to immunoblot analysis for cleaved caspase-3 and glyceraldehyde-3-phosphate dehydrogenase (GAPDH; D). Cell lysates were prepared and subjected to immunoblot analysis with antibodies for PCNA, cyclin D1, cyclin E, or α-tubulin (E). Representative immunoblots from three experiments are shown. The levels of PCNA, cyclin D1, and cyclin E were quantified by densitometry and normalized with α-tubulin (F). Values are the means ± S.D. of three independent experiments. Bars with different letters (a–e) are significantly different from one another (P < 0.01).
Fig. 3.
Fig. 3.
SIRT1 and SIRT2 inhibitors suppress renal fibroblast activation. The cell lysates prepared from cultured NRK-49F cells were subjected to immunoblot analysis for the expression of SIRT1 and SIRT2 (A). NRK-49F cells were treated with EX527 (0–100 μM) and AGK2 (0–100 μM) for 36 hours. Then, cell lysates were prepared and subjected to immunoblot analysis with antibodies for acetyl-H3K9 (Ac-H3K9), α-SMA, collagen I, fibronectin, or glyceraldehyde-3-phosphate dehydrogenase (GAPDH; B and D). Representative immunoblots from three experiments are shown. The levels of α-SMA, collagen I, and fibronectin were quantified by densitometry and normalized with GAPDH (C and E). SIRT1 and SIRT2 activity was measured in NRK-49F cells treated with EX527 and AGK2 by an enzymatic assay kit with fluorescence-labeled acetylated peptide as substrate. The value was expressed as the percentage of inhibition in each sample relative to controls (F and G). Values are the means ± S.D. of three independent experiments. Bars with different letters (a–d) are significantly different from one another (P < 0.01).
Fig. 4.
Fig. 4.
Effects of SIRT1 and SIRT2 inhibitors on renal fibroblast proliferation. NRK-49F cells were cultured in medium with 5% fetal bovine serum and treated with EX527 (0–100 μM) and AGK2 (0–100 μM) for 36 hours (A–F). Then, cell lysates were prepared and subjected to immunoblot analysis with antibodies for PCNA, cyclin D1, cyclin E, or glyceraldehyde-3-phosphate dehydrogenase (GAPDH; A and B). Representative immunoblots from three experiments are shown. The levels of PCNA, cyclin D1, and cyclin E were quantified by densitometry and normalized with GAPDH (C and D). NRK-49F cells were treated with the indicated concentration of EX527 and AGK2 for 36 hours, cells were randomly photographed in bright field (200×), and cell proliferation was measured by cell counting (E) or the MTT assay (F). To measure cell death, cultured NRK-49F cells were exposed to the same concentrations (0–100 μM) of EX527 or AGK2 for 48 hours or treated with 1 mM H2O2 for 3 hours as positive control. Cell lysates were subjected to immunoblot analysis for cleaved caspase-3 and GAPDH (G and H). Values are the means ± S.D. of three independent experiments. Bars with different letters (a–e) are significantly different from one another (P < 0.01).
Fig. 5.
Fig. 5.
Knockdown of SIRT1 and SIRT2 inhibits renal fibroblast activation. NRK-49F cells were transfected with siRNA targeting SIRT1 and SIRT2 or scrambled siRNA and then incubated in normal culture medium with 5% fetal bovine serum. At 48 hours after transfection, cell lysates were prepared for immunoblot analysis with antibodies against SIRT1, SIRT2, acetyl-H3K9 (Ac-H3K9), α-SMA, collagen I, fibronectin, PCNA, or glyceraldehyde-3-phosphate dehydrogenase (GAPDH; A and B). The levels of SIRT1, SIRT2, α-SMA, collagen I, fibronectin, and PCNA were quantified by densitometry and normalized with GAPDH (C–E). Values are the means ± S.D. of three independent experiments. Bars with different letters (a–c) are significantly different from one another (P < 0.01). Con, control.
Fig. 6.
Fig. 6.
Effects of SIRT1 and -2 inhibitors and siRNA on EGFR and PDGFRβ phosphorylation. Cultured NRK-49F cells were treated with sirtinol (0–50 μM), EX527 (0–100 μM), or AGK2 (0–100 μM) for 36 hours (A–F) or cells were transfected with siRNA targeting SIRT1 and SIRT2 or scrambled siRNA and then cultured for 48 hours (G and H). Cell lysates were prepared and subjected to immunoblot analysis with antibodies for phospho-EGFR (pEGFR; Tyr1068), phospho-PDGFRβ (pPDGFRβ; Tyr751), EGFR, PDGFRβ, glyceraldehyde-3-phosphate dehydrogenase (GAPDH), or α-tubulin (A, C, E, and G). Representative immunoblots from three experiments are shown. The phosphorylated and total levels of EGFR and PDGFRβ were quantified by densitometry and phosphorylated protein levels were normalized to total protein levels (B, D, F, and H). Values are the means ± S.D. of three independent experiments. Bars with different letters (a–c) are significantly different from one another (P < 0.01). Con, control.
Fig. 7.
Fig. 7.
SIRT inhibitors inhibit STAT3 phosphorylation in renal fibroblasts. NRK-49F cells were cultured in medium with 5% fetal bovine serum (FBS) and then treated with sirtinol (0–50 μM), EX527 (0–100 μM), and AGK2 (0–100 μM) for 36 hours (A–E and G). NRK-49F cells were transfected with siRNA targeting SIRT1 and SIRT2 or scrambled siRNA and incubated in normal culture medium with 5% FBS, and cells were harvested 48 hours after transfection for immunoblot analysis (F and H). After treatment, cell lysates were prepared and subjected to immunoblot analysis with antibodies for phospho-STAT3 (pSTAT3; Tyr705) or STAT3 (A, B, E, and F). Representative immunoblots from three experiments are shown. The phosphorylated and total levels of STAT3 were quantified by densitometry, and phosphorylated protein levels were normalized to total protein levels (C, D, G, and H). Values are the means ± S.D. of three independent experiments. Bars with different letters (a–d) are significantly different from one another (P < 0.01). Con, control.
Fig. 8.
Fig. 8.
Administration of sirtinol attenuates development of renal fibrosis and deposition of ECM in obstructed kidneys. (A) Photomicrographs illustrating Masson trichrome staining of kidney tissue after treatment with or without sirtinol. (B) The Masson trichrome–positive tubulointerstitial area (blue in A) relative to the whole area from 10 random cortical fields (200×) (means ± S.D.) was analyzed. Data are represented as the mean ± S.D. (n = 6). Means with different superscript letters are significantly different from one another (P < 0.01). (C) Kidney tissue lysates were subjected to immunoblot analysis with antibodies against α-SMA, collagen I (COL1), fibronectin (FN), or β-actin. The levels of α-SMA, collagen I, and fibronectin were quantified by densitometry and normalized with β-actin (D–F). SIRT1 and SIRT2 activity was measured by an enzymatic assay with fluorescence-labeled acetylated peptide as substrate. The value was expressed as the percentage of inhibition in each sample relative to controls (G and H). Values are the means ± S.D. (n = 6). Bars with different letters (a–d) are significantly different from one another (P < 0.01).
Fig. 9.
Fig. 9.
Effect of sirtinol on phosphorylation of EGFR and PDGFRβ in obstructed kidneys. Kidney tissue lysates were prepared and subjected to immunoblot analysis with antibodies for phospho-EGFR (pEGFR; Tyr1068), phospho-PDGFRβ (pPDGFRβ; Tyr751), EGFR, PDGFRβ, or β-actin (A). The phosphorylated and total levels of EGFR and PDGFRβ and β-actin were quantified by densitometry, and phosphorylated protein levels were normalized to total protein levels (B and D). The levels of EGFR and PDGFRβ were normalized with β-actin (C and E). Values are the means ± S.D. (n = 6). Bars with different letters (a–c) are significantly different from one another (P < 0.01).
Fig. 10.
Fig. 10.
Effect of sirtinol on STAT3 phosphorylation in obstructed kidneys. Kidney tissue lysates were prepared and subjected to immunoblot analysis with antibodies for phospho-STAT3 (pSTAT3; Tyr705), STAT3, or β-actin (A). The phosphorylated and total levels of STAT3 and β-actin were quantified by densitometry, phosphorylated STAT3 level was normalized to total STAT3 (B), and STAT3 level was normalized with β-actin (C). Values are the means ± S.D. (n = 6). Bars with different letters (a–d) are significantly different from one another (P < 0.01).

Similar articles

Cited by

References

    1. Akgedik R, Akgedik S, Karamanlı H, Uysal S, Bozkurt B, Ozol D, Armutcu F, Yıldırım Z. (2012) Effect of resveratrol on treatment of bleomycin-induced pulmonary fibrosis in rats. Inflammation 35:1732–1741 - PubMed
    1. Beher D, Wu J, Cumine S, Kim KW, Lu SC, Atangan L, Wang M. (2009) Resveratrol is not a direct activator of SIRT1 enzyme activity. Chem Biol Drug Des 74:619–624 - PubMed
    1. Bonner JC. (2004) Regulation of PDGF and its receptors in fibrotic diseases. Cytokine Growth Factor Rev 15:255–273 - PubMed
    1. Catania A, Iavarone C, Carlomagno SM, Chiariello M. (2006) Selective transcription and cellular proliferation induced by PDGF require histone deacetylase activity. Biochem Biophys Res Commun 343:544–554 - PubMed
    1. Fan H, Yang HC, You L, Wang YY, He WJ, Hao CM. (2013) The histone deacetylase, SIRT1, contributes to the resistance of young mice to ischemia/reperfusion-induced acute kidney injury. Kidney Int 83:404–413 - PubMed

Publication types

MeSH terms