

Biological functional annotation of retinoic acid alpha and beta in mouse liver based on genome-wide binding
- PMID: 24833708
- PMCID: PMC4101682
- DOI: 10.1152/ajpgi.00105.2014
Biological functional annotation of retinoic acid alpha and beta in mouse liver based on genome-wide binding
Abstract
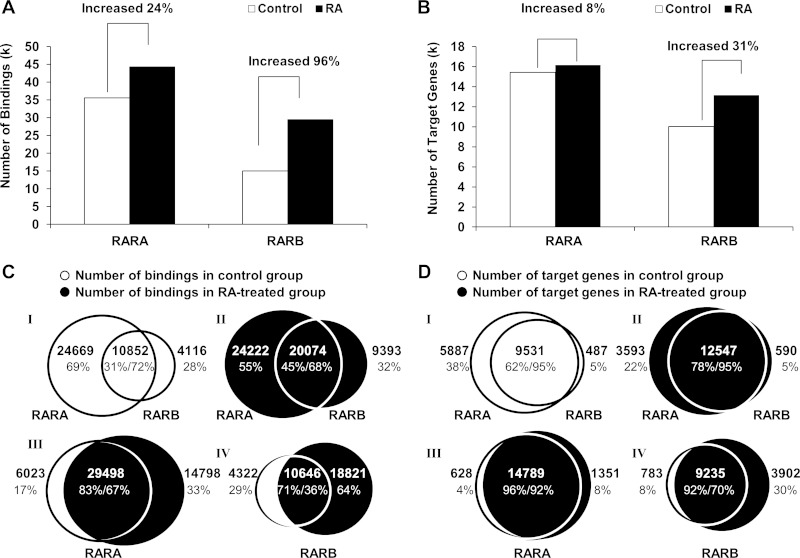
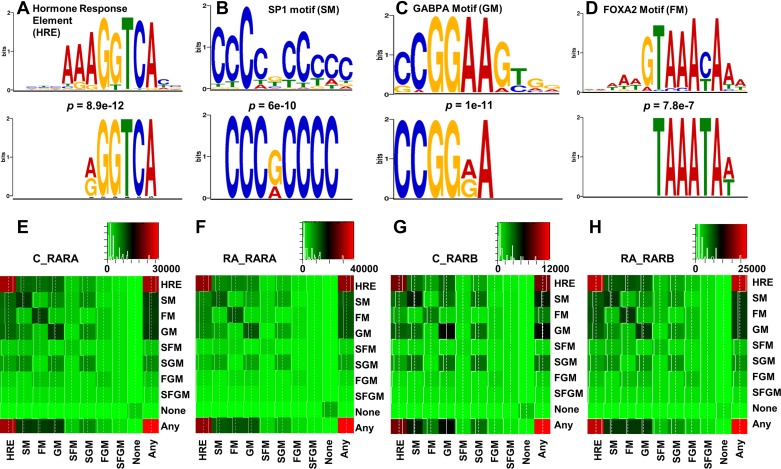
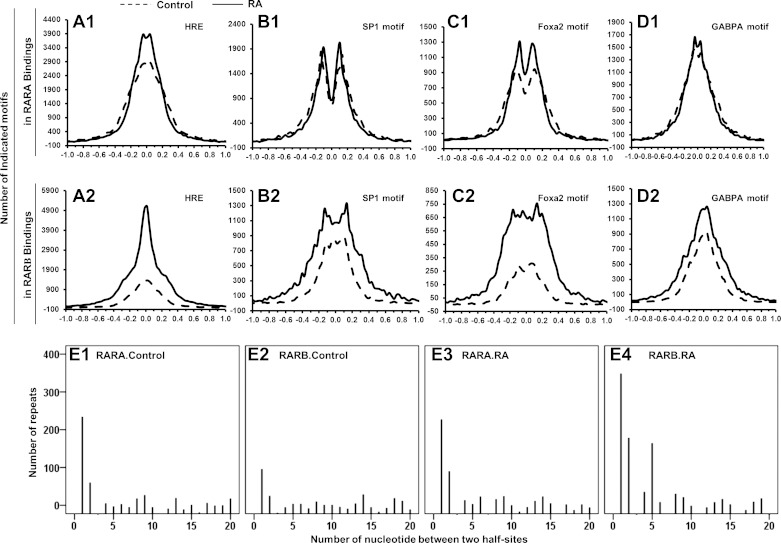
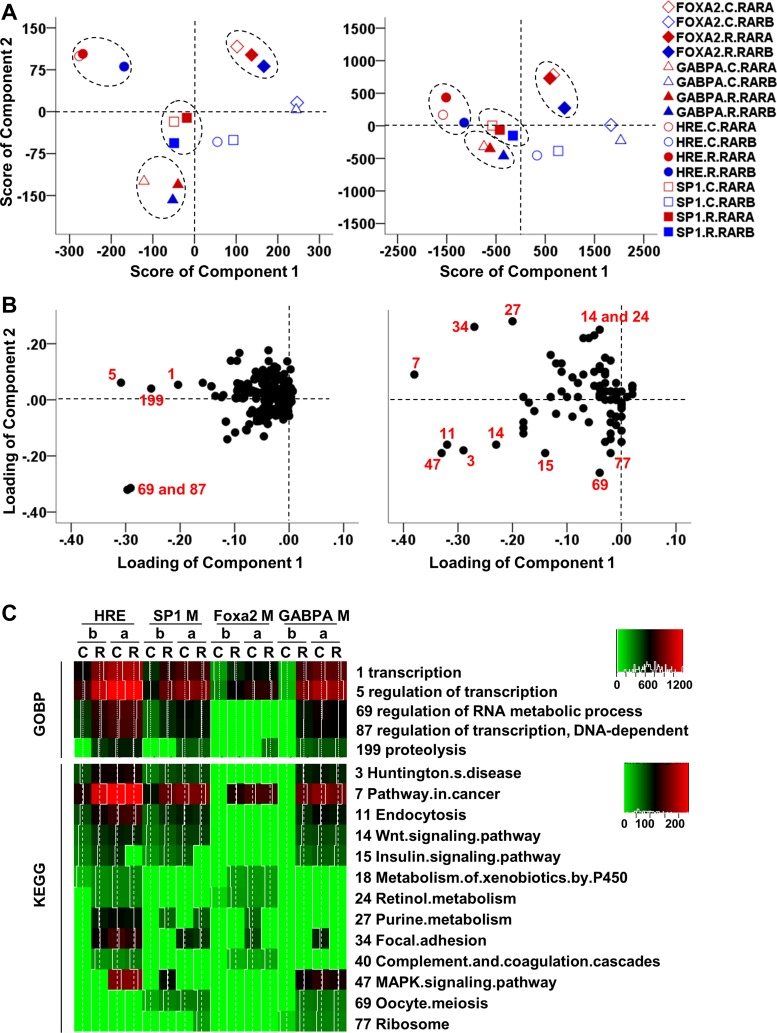
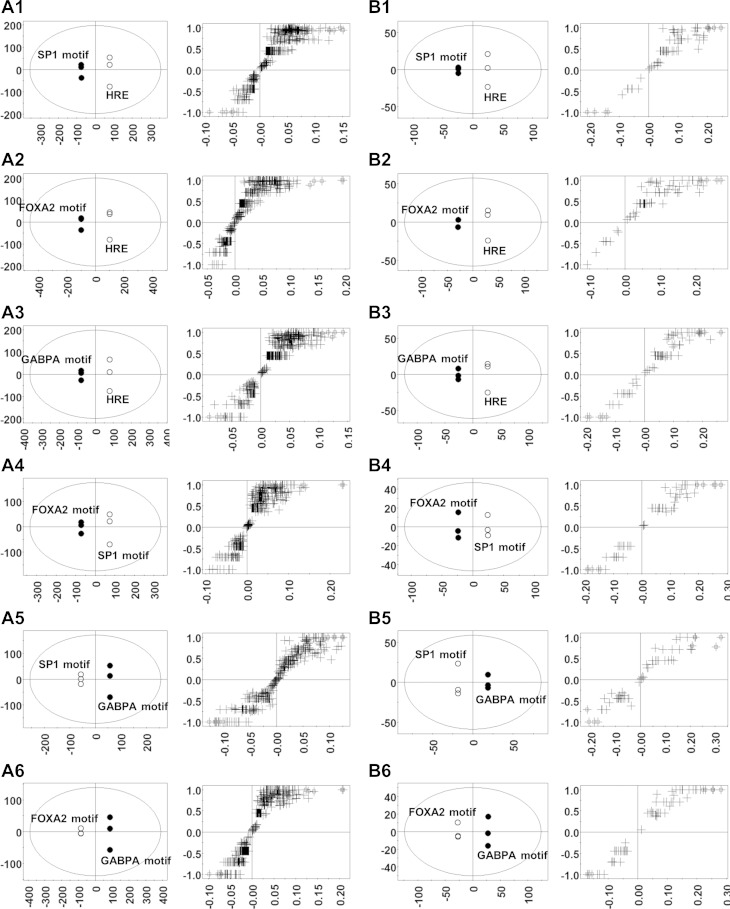
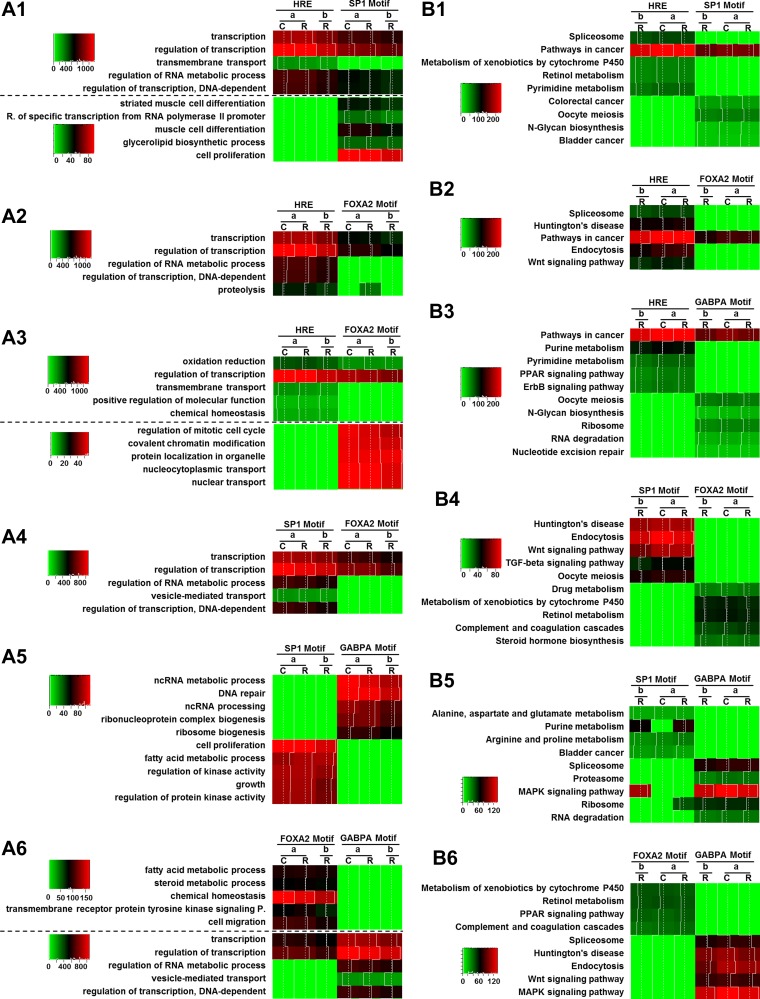
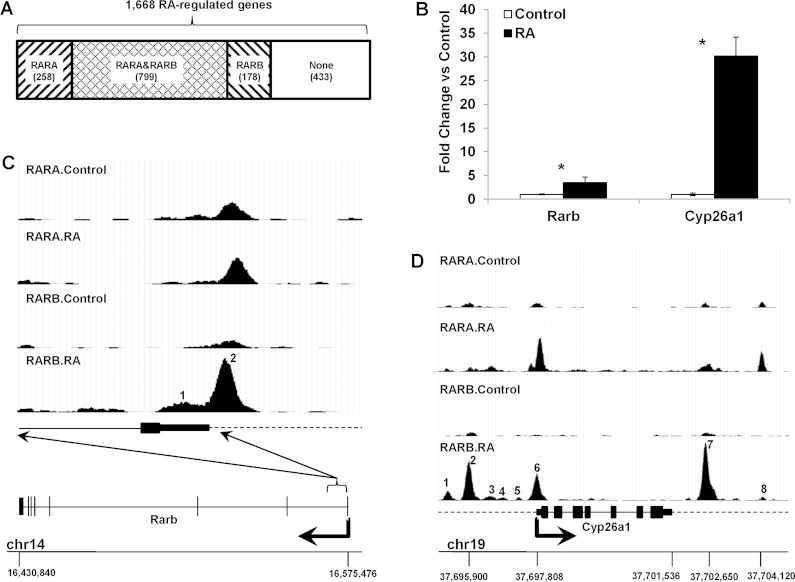
Retinoic acid (RA) has diverse biological effects. The liver stores vitamin A, generates RA, and expresses receptors for RA. The current study examines the hepatic binding profile of two RA receptor isoforms, RARA (RARα) and RARB (RARβ), in response to RA treatment in mouse livers. Our data uncovered 35,521, and 14,968 genomic bindings for RARA and RARB, respectively. Each expressed unique and common bindings, implying their redundant and specific roles. RARB has higher RA responsiveness than RARB. RA treatment generated 18,821 novel RARB bindings but only 14,798 of RARA bindings, compared with the control group. RAR frequently bound the consensus hormone response element [HRE; (A/G)G(G/T)TCA], which often contained the motifs assigned to SP1, GABPA, and FOXA2, suggesting potential interactions between those transcriptional factors. Functional annotation coupled with principle component analysis revealed that the function of RAR target genes were motif dependent. Taken together, the cistrome of RARA and RARB revealed their extensive biological roles in the mouse liver. RAR target genes are enriched in various biological processes. The hepatic RAR genome-wide binding data can help us understand the global molecular mechanisms underlying RAR and RA-mediated gene and pathway regulation.
Keywords: ChIP-Seq; cistrome; liver; motif; retinoic acid.
Copyright © 2014 the American Physiological Society.
Figures
Similar articles
-
Genome-wide Analysis of RARβ Transcriptional Targets in Mouse Striatum Links Retinoic Acid Signaling with Huntington's Disease and Other Neurodegenerative Disorders.Mol Neurobiol. 2017 Jul;54(5):3859-3878. doi: 10.1007/s12035-016-0010-4. Epub 2016 Jul 12. Mol Neurobiol. 2017. PMID: 27405468
-
Aromatase activity induction in human adipose fibroblasts by retinoic acids via retinoic acid receptor α.J Mol Endocrinol. 2013 Sep 10;51(2):247-60. doi: 10.1530/JME-12-0129. Print 2013 Oct. J Mol Endocrinol. 2013. PMID: 24023268
-
A novel retinoic acid-responsive element regulates retinoic acid-induced BLR1 expression.Mol Cell Biol. 2004 Mar;24(6):2423-43. doi: 10.1128/MCB.24.6.2423-2443.2004. Mol Cell Biol. 2004. PMID: 14993281 Free PMC article.
-
Acceleration of thrombomodulin gene transcription by retinoic acid: retinoic acid receptors and Sp1 regulate the promoter activity through interactions with two different sequences in the 5'-flanking region of human gene.J Biol Chem. 2001 Jan 26;276(4):2440-50. doi: 10.1074/jbc.M004942200. Epub 2000 Oct 17. J Biol Chem. 2001. PMID: 11036068
-
Insufficient support for retinoic acid receptor control of synaptic plasticity through a non-genomic mechanism.Front Neuroendocrinol. 2023 Oct;71:101099. doi: 10.1016/j.yfrne.2023.101099. Epub 2023 Aug 28. Front Neuroendocrinol. 2023. PMID: 37647946 Free PMC article. Review.
Cited by
-
Evaluation of Prenatal Transportation Stress on DNA Methylation (DNAm) and Gene Expression in the Hypothalamic-Pituitary-Adrenal (HPA) Axis Tissues of Mature Brahman Cows.Genes (Basel). 2025 Feb 4;16(2):191. doi: 10.3390/genes16020191. Genes (Basel). 2025. PMID: 40004522 Free PMC article.
-
Dysregulated bile acid synthesis and dysbiosis are implicated in Western diet-induced systemic inflammation, microglial activation, and reduced neuroplasticity.FASEB J. 2018 May;32(5):2866-2877. doi: 10.1096/fj.201700984RR. Epub 2018 Jan 10. FASEB J. 2018. PMID: 29401580 Free PMC article.
-
RARβ acts as both an upstream regulator and downstream effector of miR-22, which epigenetically regulates NUR77 to induce apoptosis of colon cancer cells.FASEB J. 2019 Feb;33(2):2314-2326. doi: 10.1096/fj.201801390R. Epub 2018 Sep 25. FASEB J. 2019. PMID: 30252536 Free PMC article.
-
Retinoids Issued from Hepatic Stellate Cell Lipid Droplet Loss as Potential Signaling Molecules Orchestrating a Multicellular Liver Injury Response.Cells. 2018 Sep 13;7(9):137. doi: 10.3390/cells7090137. Cells. 2018. PMID: 30217095 Free PMC article.
-
RDH1 suppresses adiposity by promoting brown adipose adaptation to fasting and re-feeding.Cell Mol Life Sci. 2019 Jun;76(12):2425-2447. doi: 10.1007/s00018-019-03046-z. Epub 2019 Feb 20. Cell Mol Life Sci. 2019. PMID: 30788515 Free PMC article.
References
-
- Amengual J, Ribot J, Bonet ML, Palou A. Retinoic acid treatment enhances lipid oxidation and inhibits lipid biosynthesis capacities in the liver of mice. Cell Physiol Biochem 25: 657–666, 2010. - PubMed
-
- Balmer JE, Blomhoff R. Gene expression regulation by retinoic acid. J Lipid Res 43: 1773–1808, 2002. - PubMed
-
- Berg WJ, Nanus DM, Leung A, Brown KT, Hutchinson B, Mazumdar M, Xu XC, Lotan R, Reuter VE, Motzer RJ. Up-regulation of retinoic acid receptor beta expression in renal cancers in vivo correlates with response to 13-cis-retinoic acid and interferon-alpha-2a. Clin Cancer Res 5: 1671–1675, 1999. - PubMed
-
- Boergesen M, Pedersen TA, Gross B, van Heeringen SJ, Hagenbeek D, Bindesboll C, Caron S, Lalloyer F, Steffensen KR, Nebb HI, Gustafsson JA, Stunnenberg HG, Staels B, Mandrup S. Genome-wide profiling of liver x receptor, retinoid x receptor, and peroxisome proliferator-activated receptor alpha in mouse liver reveals extensive sharing of binding sites. Mol Cell Biol 32: 852–867, 2012. - PMC - PubMed
Publication types
MeSH terms
Substances
Grants and funding
LinkOut - more resources
Full Text Sources
Other Literature Sources
Molecular Biology Databases