. 2014 May 8:16:9.
doi: 10.1186/1480-9222-16-9. eCollection 2014.

A convenient, optimized pipeline for isolation, fluorescence microscopy and molecular analysis of live single cells

Affiliations

A convenient, optimized pipeline for isolation, fluorescence microscopy and molecular analysis of live single cells

Jordan R Yaron et al. Biol Proced Online. .

Abstract

Background: Heterogeneity within cell populations is relevant to the onset and progression of disease, as well as development and maintenance of homeostasis. Analysis and understanding of the roles of heterogeneity in biological systems require methods and technologies that are capable of single cell resolution. Single cell gene expression analysis by RT-qPCR is an established technique for identifying transcriptomic heterogeneity in cellular populations, but it generally requires specialized equipment or tedious manipulations for cell isolation.

Results: We describe the optimization of a simple, inexpensive and rapid pipeline which includes isolation and culture of live single cells as well as fluorescence microscopy and gene expression analysis of the same single cells by RT-qPCR. We characterize the efficiency of single cell isolation and demonstrate our method by identifying single GFP-expressing cells from a mixed population of GFP-positive and negative cells by correlating fluorescence microscopy and RT-qPCR.

Conclusions: Single cell gene expression analysis by RT-qPCR is a convenient means for investigating cellular heterogeneity, but is most useful when correlating observations with additional measurements. We demonstrate a convenient and simple pipeline for multiplexing single cell RT-qPCR with fluorescence microscopy which is adaptable to other molecular analyses.

Keywords: Fluorescence microscopy; Gene expression analysis; RT-qPCR; Single cell.


Figures

Figure 1
Figure 1
Schematic overview of the pipeline. A) Succinct overview of the pipeline, sectioned into three main processes: preparation, microscopy, and gene expression. Approximate time per plate for each step in the procedure is shown. B) Diagram of the cell isolation process. Diluted solutions of cells are dispensed into fluidically isolated wells of a Terasaki plate. Inset illustrates the spreading morphology of a single adherent cell on the plate. C) Concentration curve experiments with MDA-MB-231 cells demonstrating the ability to tune the well occupancy by altering initial seeding concentration according to Poisson statistics. Approximately 200–300 cells/mL was identified as the optimal concentration for obtaining single cells. Error bars represent standard deviation and curves represent Poisson fit. D) Demonstration of three-color fluorescence on the Terasaki plates. An isolated THP-1 cell is stained with Hoechst 33342 (DNA; blue), Calcein AM (cell membrane integrity; green) and MitoTracker CMXRos (mitochondria; red). Main scale bar represents 100 μm and inset scale bar represents 5 μm.
Figure 2
Figure 2
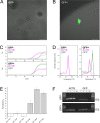
Identification of single GFP-positive and negative cells from a mixed population. A-B) Adherent GFP-negative and GFP-positive cells obtained by the described cell isolation method and observed by fluorescence microscopy. C) qPCR curves demonstrating the ability to differentiate between GFP-negative (top) and GFP-positive (bottom) cells without pre-amplification. Two gene targets were identified in each single cell: beta-actin (magenta) and GFP (green). The delayed amplification shown in the GFP-negative curves are caused by primer dimers, as supported by melt curve analysis, agarose gel electrophoresis and DNA sequencing. D) Melt curve analysis showing the identification of individual peaks corresponding to the presence or absence of GFP (green), while beta-actin is observed at similar levels in both samples (magenta). E) Analyzed data for three GFP-positive (left group) and three GFP-negative (right group) cells isolated from a mixed population of cells. Results for each single cell were normalized to expression of beta-actin (ACTB) and reported as normalized Cq, which is defined as Cq, GFP - Cq, ACTB. Error bars represent standard deviation of 3 technical replicates of divided samples from individual cells. The difference between normalized Cq from GFP+/- is significant as determined by T-test with p < 0.05. F) Validation gel illustrating the presence of beta-actin in both cells, but a differential presence of GFP amplification in cells which were observed to be GFP-positive versus GFP-negative. Off-target bands in the negative control are primer dimers as confirmed by melt-curve analysis.
Figure 3
Figure 3
Cell lysis procedure. A visual reference for performing cell lysis as described in the step-wise protocol. A) Total medium from target wells are transferred to a PCR tube containing 10 μL RNA lysis buffer and pipetted up and down. B) RNA lysis buffer is added to the target well to the same PCR tube as in A. Procedures B and C are repeated once for a total of 3 transfers from each target well.

References

    1. Johnson J, Newby A. Macrophage heterogeneity in atherosclerotic plaques. Curr Opin Lipidol. 2009;20:370–378. doi: 10.1097/MOL.0b013e3283309848. - DOI - PMC - PubMed
    1. Klein C, Blankenstein T. Genetic heterogeneity of single disseminated tumour cells in minimal residual cancer. Lancet. 2002;360:683–689. doi: 10.1016/S0140-6736(02)09838-0. - DOI - PubMed
    1. Pardal R, Clarke MF, Morrison SJ. Applying the principles of stem-cell biology to cancer. Nat Rev Cancer. 2003;3:895–902. doi: 10.1038/nrc1232. - DOI - PubMed
    1. Levsky JM, Singer RH. Gene expression and the myth of the average cell. Trends Cell Biol. 2003;13:4–6. doi: 10.1016/S0962-8924(02)00002-8. - DOI - PubMed
    1. De Souza N. Single-cell methods. Nat Methods. 2011;9:35.