. 2014 May 6:8:156.
doi: 10.3389/fnbeh.2014.00156. eCollection 2014.

Brain functional connectivity changes in children that differ in impulsivity temperamental trait

Affiliations

Brain functional connectivity changes in children that differ in impulsivity temperamental trait

Alberto Inuggi et al. Front Behav Neurosci. .

Abstract

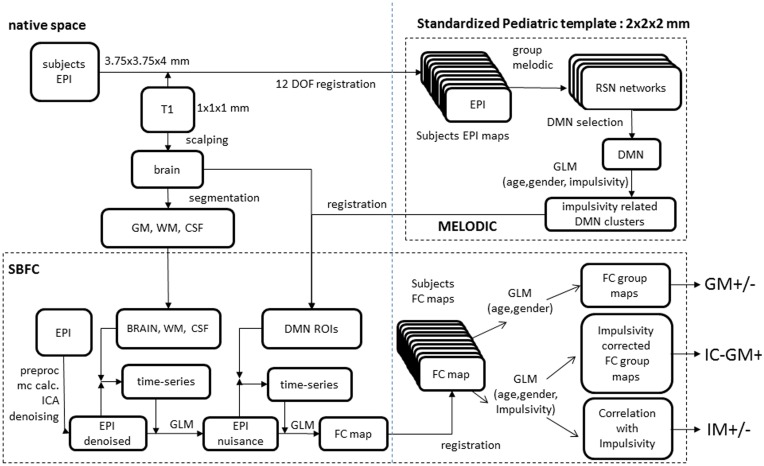
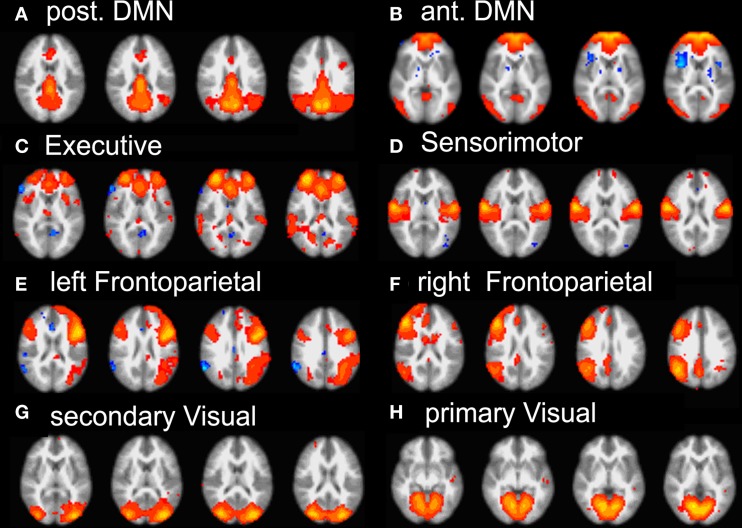
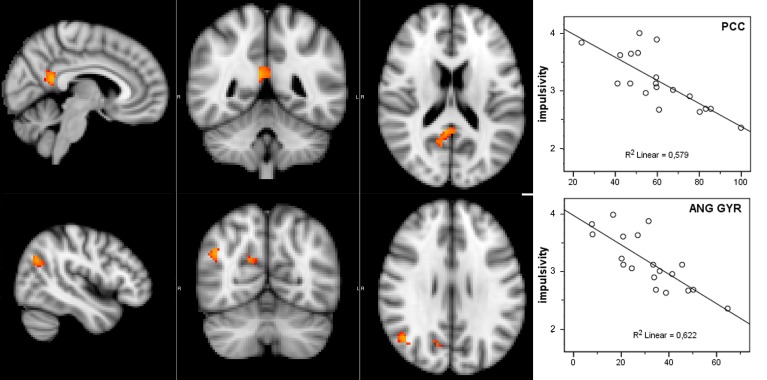
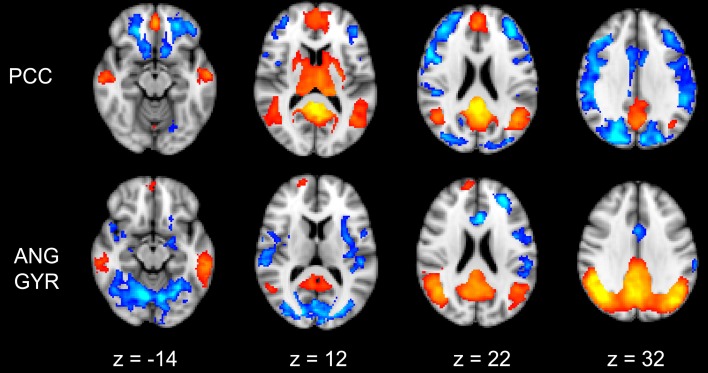
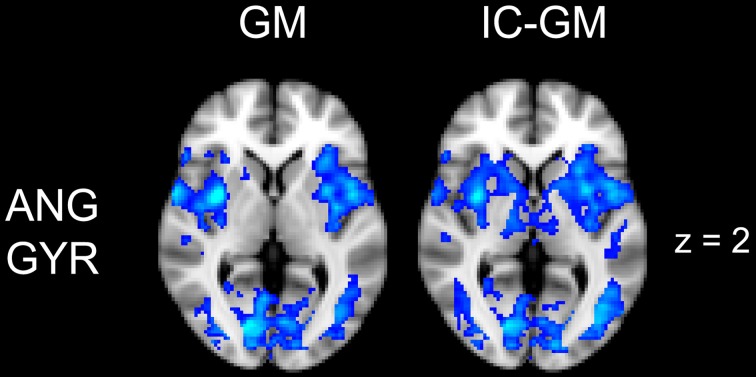
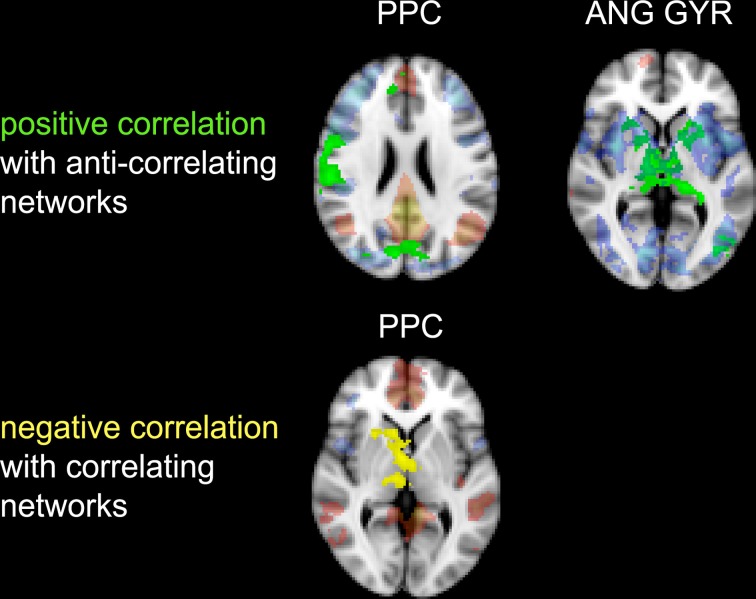
Impulsivity is a core personality trait forming part of normal behavior and contributing to adaptive functioning. However, in typically developing children, altered patterns of impulsivity constitute a risk factor for the development of behavioral problems. Since both pathological and non-pathological states are commonly characterized by continuous transitions, we used a correlative approach to investigate the potential link between personality and brain dynamics. We related brain functional connectivity of typically developing children, measured with magnetic resonance imaging at rest, with their impulsivity scores obtained from a questionnaire completed by their parents. We first looked for areas within the default mode network (DMN) whose functional connectivity might be modulated by trait impulsivity. Then, we calculated the functional connectivity among these regions and the rest of the brain in order to assess if impulsivity trait altered their relationships. We found two DMN clusters located at the posterior cingulate cortex and the right angular gyrus which were negatively correlated with impulsivity scores. The whole-brain correlation analysis revealed the classic network of correlating and anti-correlating areas with respect to the DMN. The impulsivity trait modulated such pattern showing that the canonical anti-phasic relation between DMN and action-related network was reduced in high impulsive children. These results represent the first evidence that the impulsivity, measured as personality trait assessed through parents' report, exerts a modulatory influence over the functional connectivity of resting state brain networks in typically developing children. The present study goes further to connect developmental approaches, mainly based on data collected through the use of questionnaires, and behavioral neuroscience, interested in how differences in brain structure and functions reflect in differences in behavior.

Keywords: MRI; default mode network; functional connectivity; impulsivity trait; rs-MRI.


Figures

Figure 1
Figure 1
Analyses scheme. (Upper right) melodic analysis. (lower pane) seed-based functional connectivity analysis. Details of EPI to custom template registration, involving anatomical T1 and one-volume whole-brain EPI images were omitted for simplicity.
Figure 2
Figure 2
Summary of the eight RSN revealed by group-melodic analysis. (A) posterior DMN, (B) anterior DMN, (C) executive, (D) somatosensory, (E) left and (F) right frontoparietal, (G) secondary and (H) primary visual.
Figure 3
Figure 3
Negative correlation between functional connectivity within the DMN and participant's impulsivity scores: (left) correlation overlaid over anatomical template, (right) scatter plot of functional connectivity PE values and impulsivity scores.
Figure 4
Figure 4
Functional connectivity group maps (GM+, GM−) of the two DMN ROIs (PCC, AG) that resulted negatively correlated with impulsivity score. In yellow-red color scale are displayed the correlating voxel (the GM+ contrast), in light blue-blue color scale the anti-correlating ones (the GM− contrast). The axial slice number is displayed below each column.
Figure 5
Figure 5
Effect of impulsivity score in functional connectivity group maps. In blue-light color scale are displayed anti-correlating. In the left column is displayed the negative functional connectivity GM- of angular gyrus with the rest of the brain. In the right column are displayed the connectivity maps of the same AG cluster after inserting the participants impulsivity Scale scores in the GLM (IC-GM).
Figure 6
Figure 6
Correlation between impulsivity and functional connectivity of the two seed clusters PCC and AG. (Upper) positive correlation (IM+), drawn in green, with voxels belonging to the anti-correlating network (IC-GM−). (Lower) negative correlation (IM−), drawn in yellow, with voxels belonging to the correlating network (IC-GM+). In semi-transparent mode are displayed the correlating (red) and anti-correlating (blue) voxel of IC-GM+ and IC-GM−.

References

    1. Allen E. A., Erhardt E. B., Damaraju E., Gruner W., Segall J. M., Silva R. F., et al. (2011). A baseline for the multivariate comparison of resting-state networks. Front. Syst. Neurosci. 5:2 10.3389/fnsys.2011.00002 - DOI - PMC - PubMed
    1. Antonucci A. S., Gansler D. A., Tan S., Bhadelia R., Patz S., Fulwiler C. (2006). Orbitofrontal correlates of aggression and impulsivity in psychiatric patients. Psychiatry Res. 147, 213–220 10.1016/j.pscychresns.2005.05.016 - DOI - PubMed
    1. Aron A. R., Robbins T. W., Poldrack R. A. (2004). Inhibition and the right inferior frontal cortex. Trends Cogn. Sci. 8, 170–177 10.1016/j.tics.2004.02.010 - DOI - PubMed
    1. Avila C., Cuenca I., Félix V., Parcet M. A., Miranda A. (2004). Measuring impulsivity in school-aged boys and examining its relationship with ADHD and ODD ratings. J. Abnorm. Child Psychol. 32, 295–304 10.1023/B:JACP.0000026143.70832.4b - DOI - PubMed
    1. Barratt E. S. (1994). Impulsiveness and aggression, in Violence and Mental Disorder: Developments in Risk Assessment, eds Monahan J., Steadman H. J. (Chicago, IL: The University of Chicago; ), 61–79

LinkOut - more resources