. 2014 Apr;4(8):1243-54.
doi: 10.1002/ece3.1020. Epub 2014 Mar 12.

Active colonization dynamics and diversity patterns are influenced by dendritic network connectivity and species interactions

Affiliations

Active colonization dynamics and diversity patterns are influenced by dendritic network connectivity and species interactions

Mathew Seymour et al. Ecol Evol. 2014 Apr.

Abstract

Habitat network connectivity influences colonization dynamics, species invasions, and biodiversity patterns. Recent theoretical work suggests dendritic networks, such as those found in rivers, alter expectations regarding colonization and dispersal dynamics compared with other network types. As many native and non-native species are spreading along river networks, this may have important ecological implications. However, experimental studies testing the effects of network structure on colonization and diversity patterns are scarce. Up to now, experimental studies have only considered networks where sites are connected with small corridors, or dispersal was experimentally controlled, which eliminates possible effects of species interactions on colonization dynamics. Here, we tested the effect of network connectivity and species interactions on colonization dynamics using continuous linear and dendritic (i.e., river-like) networks, which allow for active dispersal. We used a set of six protist species and one rotifer species in linear and dendritic microcosm networks. At the start of the experiment, we introduced species, either singularly or as a community within the networks. Species subsequently actively colonized the networks. We periodically measured densities of species throughout the networks over 2 weeks to track community dynamics, colonization, and diversity patterns. We found that colonization of dendritic networks was faster compared with colonization of linear networks, which resulted in higher local mean species richness in dendritic networks. Initially, community similarity was also greater in dendritic networks compared with linear networks, but this effect vanished over time. The presence of species interactions increased community evenness over time, compared with extrapolations from single-species setups. Our experimental findings confirm previous theoretical work and show that network connectivity, species-specific dispersal ability, and species interactions greatly influence the dispersal and colonization of dendritic networks. We argue that these factors need to be considered in empirical studies, where effects of network connectivity on colonization patterns have been largely underestimated.

Keywords: Connectivity; dispersal; landscape structure; linear network; microcosm; protist; river-like.


Figures

Figure 1
Figure 1
Four of the seven protist and rotifer species used in the microcosm experiments. The species are Euglena gracilis (A), Cephalodella sp. (B, the rotifer), Colpidium sp. (C), and Paramecium bursaria (D). The scale bar corresponds to 100 μm.
Figure 2
Figure 2
Schematic illustration of the experimental networks used in this study, made of silicon tubing. (A) Linear network and (B) dendritic network. Both continuous network types were of equal total volume (125 mL) and equal length of tubing. Each connecting section (i.e., edge) was 35 cm long and had a single opening (indicated with a circle) in the middle of the section for sampling. Tubing width and openings are given to scale. Red circles indicate the starting site where protists and the rotifer species were introduced at the onset of the experiments.
Figure 3
Figure 3
Density (individuals per mL) at the network level over time. Each panel depicts the results for a different species, with the species’ name indicated in the header of each panel (CHI = Chilomonas sp., COL = Colpidium sp., EUG = Euglena gracilis, EUP = Euplotes aediculatus, PBU = Paramecium bursaria, ROT = Cephalodella sp., and TET = Tetrahymena sp.). Points indicate the density (y-axis) at each time point sampled (x-axis). The colors correspond to the different experimental setups (orange = single-species in linear landscape, red = single-species in dendritic landscape, light blue = multiple-species in linear landscape, and dark blue = multiple-species in dendritic landscape). The upper and lower whiskers correspond to the 1.5 times interquartile range. The lines are GAM model fits of individual species’ models (Table S1), fitted to each of the separate treatment combinations.
Figure 4
Figure 4
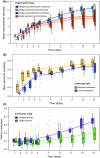
(A) Mean local species richness (α-diversity) over time for each network type used in the single- and multiple-species community setups (orange = single-species in linear network, red = single-species in dendritic network, light blue = multiple-species in linear network and dark blue = multiple-species in dendritic network). α-diversity of the single-species treatment was calculated by virtually pooling the species from individual experimental blocks and averaging across all blocks (i.e., it is a “virtual” community value). The lines are GAM model fits, fitted to each of the separate treatment combinations. The upper and lower whiskers correspond to the 1.5 times interquartile range. (B) Mean Jaccard similarity index over time for each network type used in the single- and multiple-species community setups (linear networks = blue, dendritic networks = yellow). Pairwise Jaccard similarity was calculated for all community pairs within a network, and the mean value thereof is used here. Jaccard similarities of the single-species community setups were calculated by pooling the species from individual experimental blocks and averaging across all blocks (i.e., it is a “virtual” community value). The lines are GAM model fits, fitted to each of the separate treatment combinations that were significant in the final model. (C) Mean Pielou's evenness over time for each network setup in linear and dendritic networks (single-species setup = green, multiple-species setup = purple). The lines are GAM model fits, fitted to each of the separate treatment combinations that were significant in the final model.
Figure 5
Figure 5
Occupancy (number of sites occupied) at day nine versus species-specific trait values (A) growth rate, (B) cell mass, and (C) carrying capacity. Data are from the single-species setups in the linear landscape. For significant correlations, we added the fitted curve from the corresponding linear model.

References

    1. Altermatt F. Diversity in riverine metacommunities: a network perspective. Aquat. Ecol. 2013;47:365–377.
    1. Altermatt F, Holyoak M. Spatial clustering of habitat structure effects patterns of community composition and diversity. Ecology. 2012;93:1125–1133. - PubMed
    1. Altermatt F, Bieger A, Carrara F, Rinaldo A, Holyoak M. Effects of connectivity and recurrent local disturbances on community structure and population density in experimental metacommunities. PLoS ONE. 2011a;6:e19525. - PMC - PubMed
    1. Altermatt F, Schreiber S, Holyoak M. Interactive effects of disturbance and dispersal directionality on species richness and composition in metacommunities. Ecology. 2011b;92:859–870. - PubMed
    1. Altermatt F, Seymour M, Martinez N. River network properties shape α-diversity and community similarity patterns of aquatic insect communities across major drainage basins. J. Biogeogr. 2013;40:2249–2260.

LinkOut - more resources