

A statistical simulation model for field testing of non-target organisms in environmental risk assessment of genetically modified plants
- PMID: 24834325
- PMCID: PMC4020688
- DOI: 10.1002/ece3.1019
A statistical simulation model for field testing of non-target organisms in environmental risk assessment of genetically modified plants
Abstract
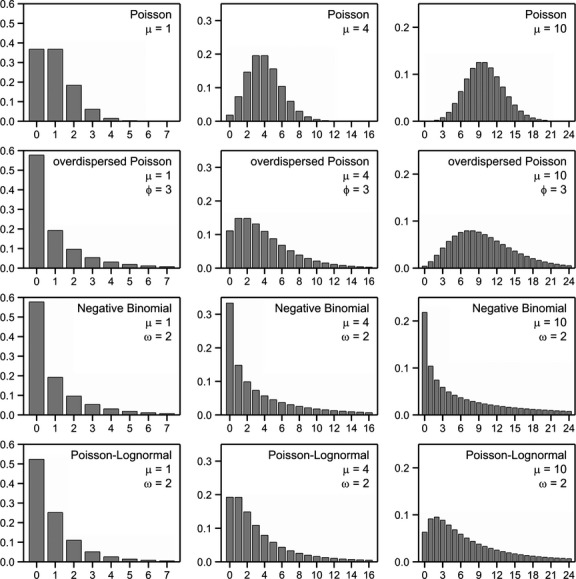
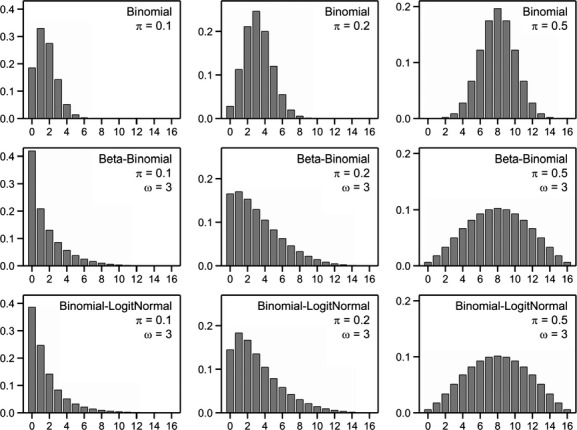
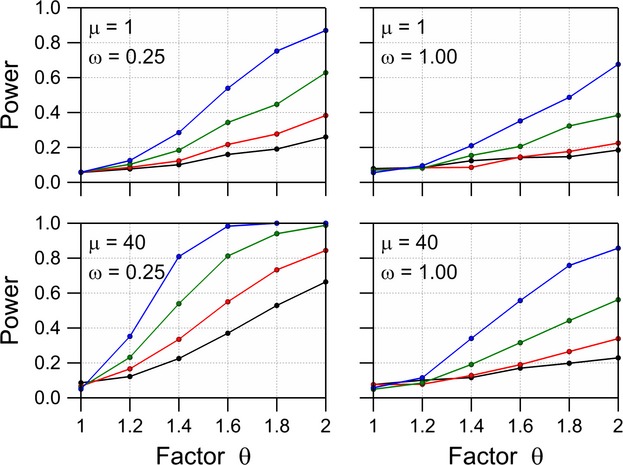
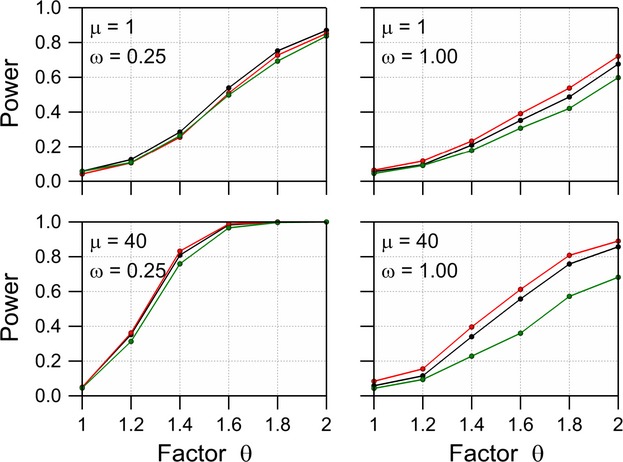
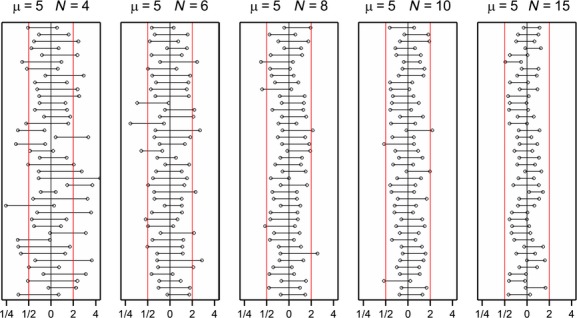
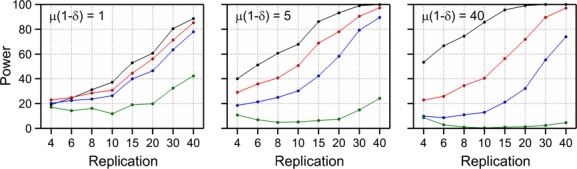
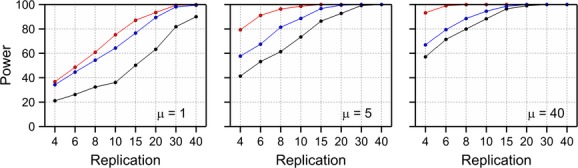
Genetic modification of plants may result in unintended effects causing potentially adverse effects on the environment. A comparative safety assessment is therefore required by authorities, such as the European Food Safety Authority, in which the genetically modified plant is compared with its conventional counterpart. Part of the environmental risk assessment is a comparative field experiment in which the effect on non-target organisms is compared. Statistical analysis of such trials come in two flavors: difference testing and equivalence testing. It is important to know the statistical properties of these, for example, the power to detect environmental change of a given magnitude, before the start of an experiment. Such prospective power analysis can best be studied by means of a statistical simulation model. This paper describes a general framework for simulating data typically encountered in environmental risk assessment of genetically modified plants. The simulation model, available as Supplementary Material, can be used to generate count data having different statistical distributions possibly with excess-zeros. In addition the model employs completely randomized or randomized block experiments, can be used to simulate single or multiple trials across environments, enables genotype by environment interaction by adding random variety effects, and finally includes repeated measures in time following a constant, linear or quadratic pattern in time possibly with some form of autocorrelation. The model also allows to add a set of reference varieties to the GM plants and its comparator to assess the natural variation which can then be used to set limits of concern for equivalence testing. The different count distributions are described in some detail and some examples of how to use the simulation model to study various aspects, including a prospective power analysis, are provided.
Keywords: Difference testing; environmental risk assessment; equivalence testing; field trials; simulation model; statistical distributions; statistical power.
Figures
References
-
- Al–Deeb MA, Wilde GE, Zhu KY. Effect of insecticides used in corn, sorghum, and alfalfa on the predator Orius insidiosus (Hemiptera: Anthocoridae) J. Econ. Entomol. 2001;94:1353–1360. - PubMed
-
- Al–Deeb MA, Wilde GE. Effect of Bt corn expressing the Cry3Bb1 toxin for corn rootworm control on aboveground nontarget arthropods. Environ. Entomol. 2003;32:1164–1170.
-
- Andow DA. Negative and positive data, statistical power, and confidence intervals. Environ. Biosaf. Res. 2003;2:75–80. - PubMed
LinkOut - more resources
Full Text Sources
Other Literature Sources
