Review
. 2014 Apr;4(2):173-92.
doi: 10.3978/j.issn.2223-3652.2014.01.02.

4D flow imaging with MRI

Affiliations
Review

4D flow imaging with MRI

Zoran Stankovic et al. Cardiovasc Diagn Ther. 2014 Apr.

Abstract

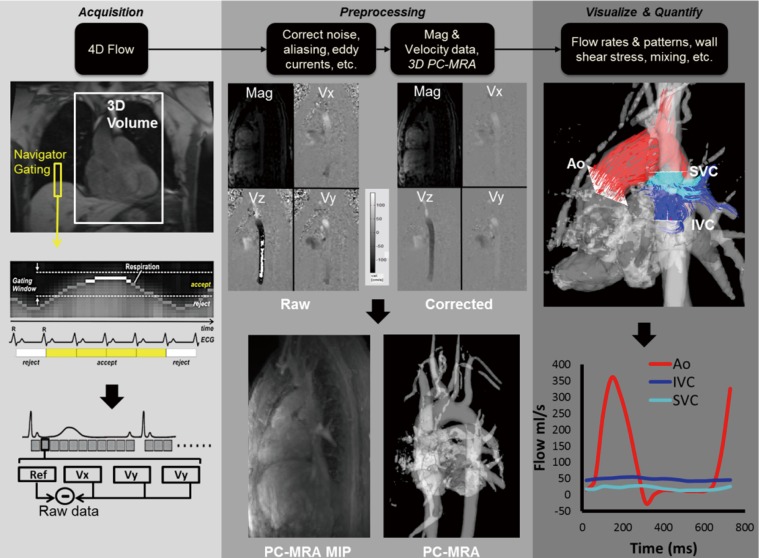
Magnetic resonance imaging (MRI) has become an important tool for the clinical evaluation of patients with cardiovascular disease. Since its introduction in the late 1980s, 2-dimensional phase contrast MRI (2D PC-MRI) has become a routine part of standard-of-care cardiac MRI for the assessment of regional blood flow in the heart and great vessels. More recently, time-resolved PC-MRI with velocity encoding along all three flow directions and three-dimensional (3D) anatomic coverage (also termed '4D flow MRI') has been developed and applied for the evaluation of cardiovascular hemodynamics in multiple regions of the human body. 4D flow MRI allows for the comprehensive evaluation of complex blood flow patterns by 3D blood flow visualization and flexible retrospective quantification of flow parameters. Recent technical developments, including the utilization of advanced parallel imaging techniques such as k-t GRAPPA, have resulted in reasonable overall scan times, e.g., 8-12 minutes for 4D flow MRI of the aorta and 10-20 minutes for whole heart coverage. As a result, the application of 4D flow MRI in a clinical setting has become more feasible, as documented by an increased number of recent reports on the utility of the technique for the assessment of cardiac and vascular hemodynamics in patient studies. A number of studies have demonstrated the potential of 4D flow MRI to provide an improved assessment of hemodynamics which might aid in the diagnosis and therapeutic management of cardiovascular diseases. The purpose of this review is to describe the methods used for 4D flow MRI acquisition, post-processing and data analysis. In addition, the article provides an overview of the clinical applications of 4D flow MRI and includes a review of applications in the heart, thoracic aorta and hepatic system.

Keywords: 4D flow magnetic resonance imaging (4D flow MRI); PC-VIPR; aorta; blood flow; carotid bifurcation; heart; hemodynamics; liver hemodynamics; peripheral arteries; phase contrast magnetic resonance imaging (PC-MRI); pulmonary arteries; quantification; renal arteries; splanchnic vessel system; visualization.


Figures

Figure 1
Figure 1
Standard 2D CINE PC-MRI with one-directional through-plane (Z) velocity encoding. (A) Data acquisition is synchronized with the RR-interval by ECG gating. For each cardiac time frame, a reference and velocity sensitive scan (bipolar encoding gradient) are acquired in direct succession. Magnitude images are calculated by averaging both scans. Subtraction of phase images provides phase difference images that contain quantitative blood flow velocities, as shown in a 2D slice above and parallel to the AoV, PA and LA. Due to time constraints, the MR data cannot be acquired during a single heartbeat, thus velocity data are collected over several cardiac cycles; (B) The selection of Venc is necessary for a proper flow measurement. Phase differences in an angle range from –π to +π or from +Venc to –Venc, defining the velocity range. Blood flow velocities in the predominant blood flow direction will appear bright and blood flow velocities in the opposite direction will appear dark. Note that velocities exceeding Venc results in velocity aliasing as shown in Figure 2. MRI, magnetic resonance imaging; AoV, the aortic valve; PA, pulmonary artery; LA, left atrium. Venc, velocity encoding sensitivity.
Figure 2
Figure 2
(A-C) 2D CINE PC-MRI with aliasing in a patient with bicuspid aortic valve disease and aortic coarctation. The patient underwent standard MR angiography (A) as well as 2D CINE PC-MRI (B and C) for the quantification of ascending aorta and post-coarctation flow velocity. Velocity aliasing due to blood flow velocities exceeding Venc can be seen within the AAo early in the cardiac cycle in (B), and again in the DAo distal to the coarctation (double white arrow) later in the cardiac cycle. The yellow line in A shows the imaging plane for 2D CINE PC-MRI acquisitions in (B) and (C); (D) 4D flow MRI with improved Venc settings and anti-aliasing corrections allowed for accurate 3D blood flow visualization without aliasing. Flow quantification based on 4D flow MRI revealed a peak velocity of 2.04 m/s in the mid-ascending aorta and 3.49 m/s in the DAo just distal to the coarctation. MRI, magnetic resonance imaging; AAo, ascending aorta ; DAo, descending aorta.
Figure 3
Figure 3
Data acquisition and analysis workflow for 4D flow MRI. (Left) 4D flow MRI data covering the whole heart (white rectangle) is acquired using ECG gating and respiratory control using diaphragm navigator gating. 3D velocity-encoding is used to obtain velocity-sensitive phase images which are subtracted from reference images to calculate blood flow velocities along all three spatial dimensions (Vx, Vy, Vz). (Middle) Data preprocessing corrects for errors due to noise, aliasing and eddy currents and calculates the 3D-PC-MRA. (Right) 3D Blood flow is visualized by emitting time resolved pathlines from analysis planes in the Ao, IVC and SVC. In addition, retrospective quantitative analysis can be used to derive flow-time curves at user selected regions of interest in the cardiovascular system. MRI, magnetic resonance imaging; Ao, aorta; IVC, inferior vena cava; SVC, superior vena cava.
Figure 4
Figure 4
Flow analysis of 4D flow whole heart dataset in patient with Fontan circulation. (A) PC-MRA (grey) and pathlines (SVC-yellow, IVC-blue) visualize vascular anatomy and blood flow in the Fontan connection; (B) Mixing quantification shows relatively uniform distribution of SVC flow. However, flow from the IVC was predominately directed toward the RPA, indicating uneven distribution of hepatic-rich venous return from the lower body; (C) Flow quantification shows RPA flow is higher than LPA flow overall. SVC, superior vena cava; IVC, inferior vena cava; LPA/RPA, left/right pulmonary artery.
Figure 5
Figure 5
Two examples of systolic 3D streamline representation of 4D flow MRI data in patients with BAV. In both cases, a posteriorly directed high velocity flow jet is present in the ascending aorta suggesting aortic stenosis as a result of the BAV (white arrow). (A) BAV patient with minimal ascending aortic dilation; (B) BAV patient with a dramatically enlarged ascending aorta aneurysm with flow jet impingement. There is also a large amount of helical flow occurring within the aneurysm. This patient underwent valve-sparing ascending aorta repair. AAo, ascending aorta; MPA, main pulmonary artery; DAo, descending aorta; BAV, bicuspid aortic valve; MRI, magnetic resonance imaging.
Figure 6
Figure 6
4D flow MRI in a 3.5-year-old pediatric patient with BAV and aortic coarctation at the distal arch/proximal descending aorta junction Systolic blood flow was visualized by 3D streamlines in anterior (A) and posterior (B) views demonstrating a high velocity flow jet in the ascending aorta and exaggerated right handed helical flow (yellow arrow). Note the significant flow derangement at the site of the coarctation with high velocity flow jets and throughout the region as well as non-laminar flow features both proximal and distal to coarctation (white double arrow). Using retrospective 4D flow MRI quantification, peak flow velocity in the mid-ascending aorta was found to be 1.16 m/s, while the post-coarctation peak velocity was measured at 1.34 m/s. BAV, bicuspid aortic valve; MRI, magnetic resonance imaging.
Figure 7
Figure 7
4D flow MRI in a patient with obstructive hypertrophic cardiomyopathy with thickening of the interventricular septum (*). (A) Systolic 3D streamlines in the anterior view shows an asymmetric flow jet in the left ventricular outflow tract as well as marked helical flow in the AAo; (B) end-diastolic frame of standard CINE SSFP MRI in three-chamber orientation in this patient demonstrating increased septal thickness; (C) co-registered 4D flow data with three-chamber SSFP cine image demonstrates the correlation between myocardial and vascular features and hemodynamic findings including the presence of MR. In this patient, LVOT pressure gradient assessed with MRI using the simplified Bernoulli equation was found to be 37.2 mmHg. AAo, ascending aorta; MR, mitral regurgitation; LVOT, left ventricular outflow tract.
Figure 8
Figure 8
4D flow MRI visualization of the hepatic hemodynamics by 3D pathlines in a 50-year-old female patient with advanced liver cirrhosis Child-Pugh class B. Analysis planes were positioned in the splenic and superior mesenteric veins, splenic-mesenteric confluence, right and left intrahepatic portal vein branches and the proximal part of the portosystemic shunt represented by the umbilical vein. Pathlines reveal normal flow in the extrahepatic portal venous system. A reopening of the umbilical vein fed via the left branch of the intrahepatic portal vein is shown with an increase of flow velocity within the umbilical vein. Graphs on the right side show flow-time curves of the splenic-mesenteric confluence, left intrahepatic portal vein branch and the re-opened umbilical vein.
Figure 9
Figure 9
Aortic valve EOA estimation with the 4D flow jet shear layer detection method. (A) 3D PC-MRA based on 4D flow data. The white box delimits the volume for EOA assessment; (B) EOA estimation of a control subject (top row, EOA =3.70 cm2) and a patient with severe bicuspid stenosis (bottom row, EOA =0.75 cm2). 3D streamlines at peak systole indicate substantially different ascending aortic flow patterns for both subjects. The structures (red surfaces) result from flow JSLD computed from 4D flow MRI data at peak systole which can be employed to quantify changes in the aortic valve EOA, i.e., valve stenosis severity. The dashed white line indicates transvalvular maximal velocity position. Ao, aorta; AoV, aortic valve; LV, left ventricle; EOA, effective orifice area; JSLD, jet shear layer detection.
Video 1
Video 1
The dynamics of 3D blood flow in a patient with bicuspid aortic valve and aortic coarctation.

Similar articles

Cited by

References

    1. Moran PR. A flow velocity zeugmatographic interlace for NMR imaging in humans. Magn Reson Imaging 1982;1:197-203 - PubMed
    1. Bryant DJ, Payne JA, Firmin DN, et al. Measurement of flow with NMR imaging using a gradient pulse and phase difference technique. J Comput Assist Tomogr 1984;8:588-93 - PubMed
    1. Nayler GL, Firmin DN, Longmore DB. Blood flow imaging by cine magnetic resonance. J Comput Assist Tomogr 1986;10:715-22 - PubMed
    1. Firmin DN, Nayler GL, Klipstein RH, et al. In vivo validation of MR velocity imaging. J Comput Assist Tomogr 1987;11:751-6 - PubMed
    1. Pelc NJ, Herfkens RJ, Shimakawa A, et al. Phase contrast cine magnetic resonance imaging. Magn Reson Q 1991;7:229-54 - PubMed