

What weather variables are important in predicting heat-related mortality? A new application of statistical learning methods
- PMID: 24834832
- PMCID: PMC4091921
- DOI: 10.1016/j.envres.2014.04.004
What weather variables are important in predicting heat-related mortality? A new application of statistical learning methods
Abstract
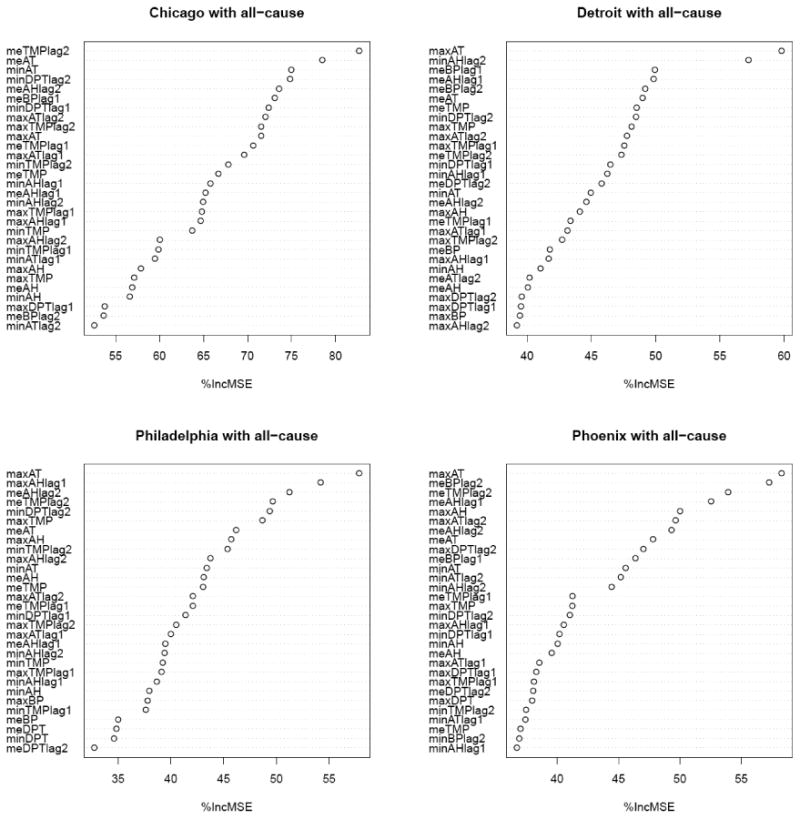
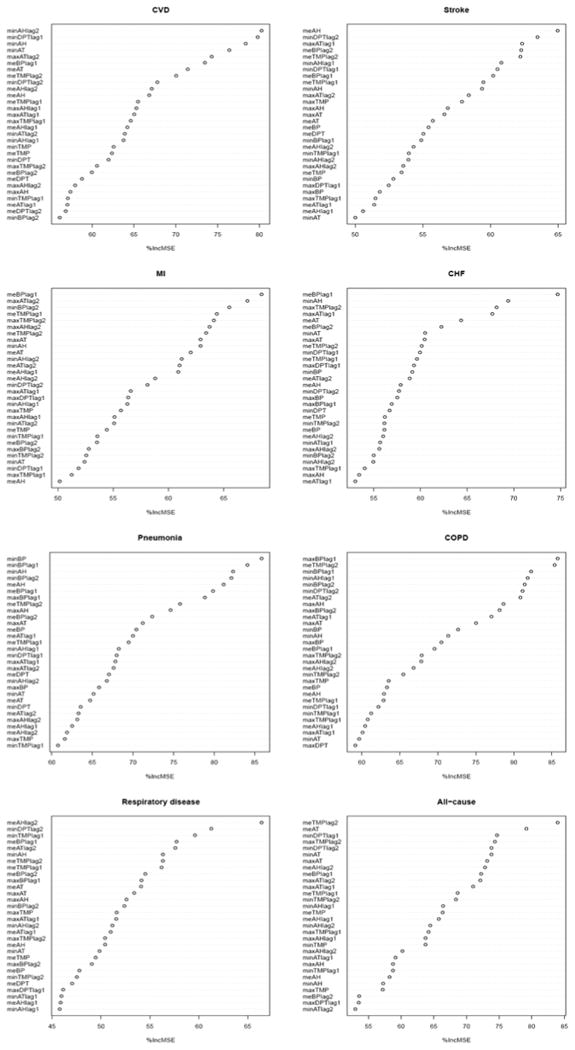
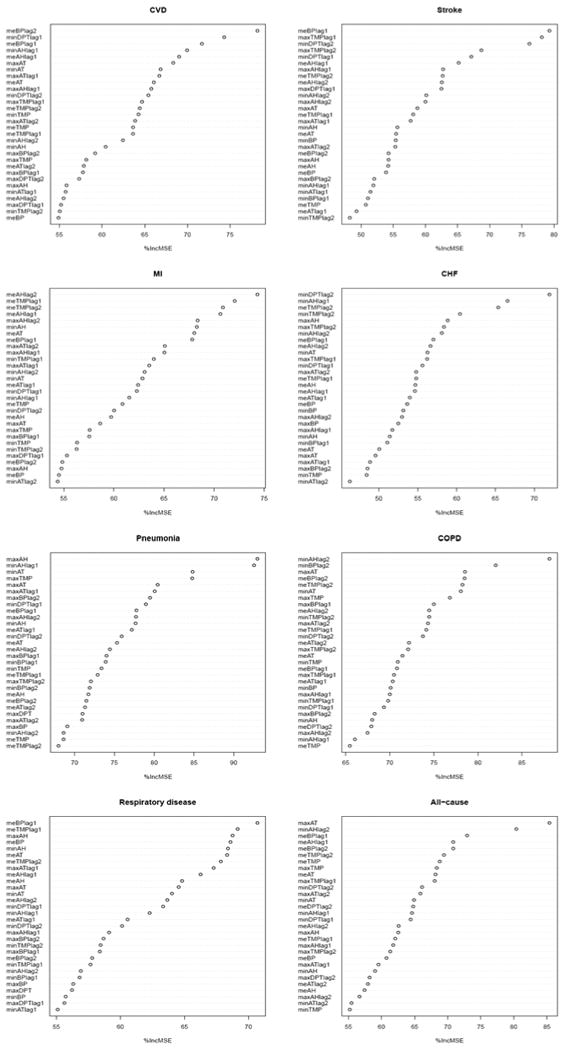
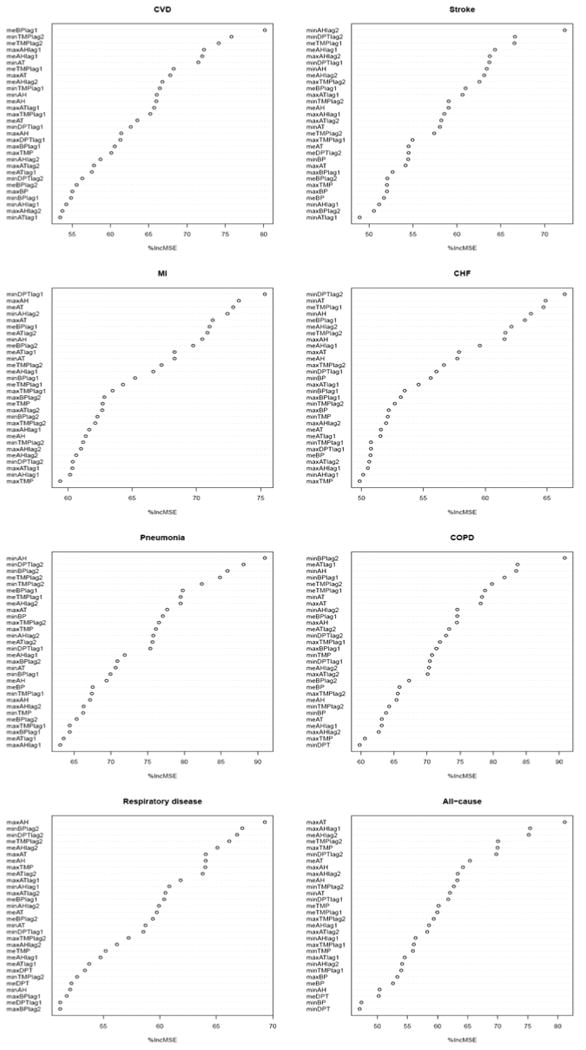
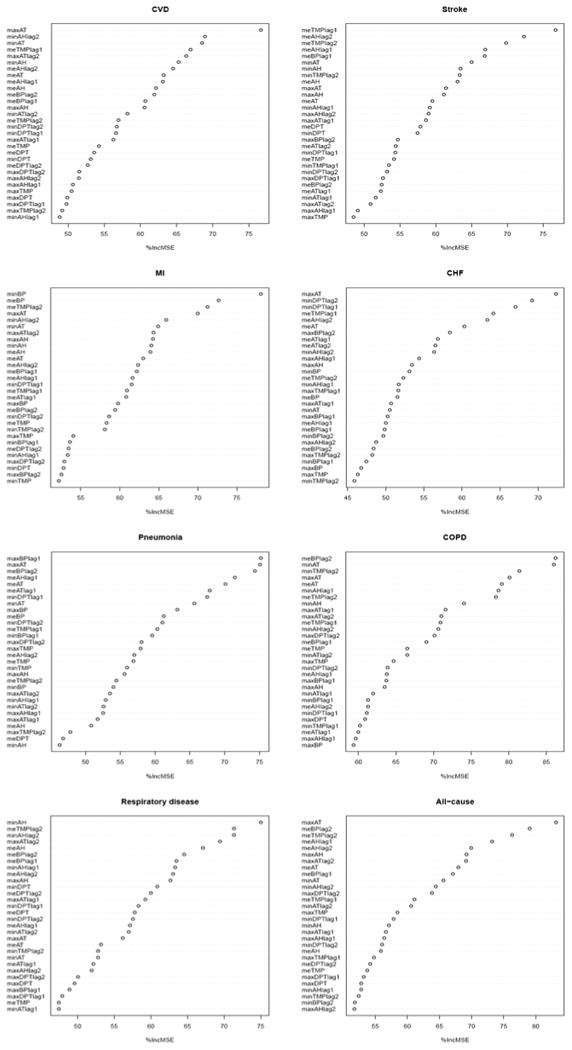
Hot weather increases risk of mortality. Previous studies used different sets of weather variables to characterize heat stress, resulting in variation in heat-mortality associations depending on the metric used. We employed a statistical learning method - random forests - to examine which of the various weather variables had the greatest impact on heat-related mortality. We compiled a summertime daily weather and mortality counts dataset from four U.S. cities (Chicago, IL; Detroit, MI; Philadelphia, PA; and Phoenix, AZ) from 1998 to 2006. A variety of weather variables were ranked in predicting deviation from typical daily all-cause and cause-specific death counts. Ranks of weather variables varied with city and health outcome. Apparent temperature appeared to be the most important predictor of heat-related mortality for all-cause mortality. Absolute humidity was, on average, most frequently selected as one of the top variables for all-cause mortality and seven cause-specific mortality categories. Our analysis affirms that apparent temperature is a reasonable variable for activating heat alerts and warnings, which are commonly based on predictions of total mortality in next few days. Additionally, absolute humidity should be included in future heat-health studies. Finally, random forests can be used to guide the choice of weather variables in heat epidemiology studies.
Keywords: Absolute humidity; Heat; Mortality; Random forests; Temperature; Weather.
Copyright © 2014 Elsevier Inc. All rights reserved.
Figures
Similar articles
-
Temperature Observation Time and Type Influence Estimates of Heat-Related Mortality in Seven U.S. Cities.Environ Health Perspect. 2016 Jun;124(6):795-804. doi: 10.1289/ehp.1509946. Epub 2015 Dec 4. Environ Health Perspect. 2016. PMID: 26636734 Free PMC article.
-
Using forecast and observed weather data to assess performance of forecast products in identifying heat waves and estimating heat wave effects on mortality.Environ Health Perspect. 2014 Sep;122(9):912-8. doi: 10.1289/ehp.1306858. Epub 2014 May 9. Environ Health Perspect. 2014. PMID: 24833618 Free PMC article.
-
Effectiveness of National Weather Service heat alerts in preventing mortality in 20 US cities.Environ Int. 2018 Jul;116:30-38. doi: 10.1016/j.envint.2018.03.028. Epub 2018 Apr 9. Environ Int. 2018. PMID: 29649774 Free PMC article.
-
A comparative climate analysis of heat-related emergency 911 dispatches: Chicago, Illinois and Phoenix, Arizona USA 2003 to 2006.Int J Biometeorol. 2013 Sep;57(5):669-78. doi: 10.1007/s00484-012-0593-z. Epub 2012 Oct 5. Int J Biometeorol. 2013. PMID: 23053064
-
The potential impacts of climate variability and change on temperature-related morbidity and mortality in the United States.Environ Health Perspect. 2001 May;109 Suppl 2(Suppl 2):185-9. doi: 10.1289/ehp.109-1240665. Environ Health Perspect. 2001. PMID: 11359685 Free PMC article. Review.
Cited by
-
Susceptibility to Heat-Related Fluid and Electrolyte Imbalance Emergency Department Visits in Atlanta, Georgia, USA.Int J Environ Res Public Health. 2016 Oct 2;13(10):982. doi: 10.3390/ijerph13100982. Int J Environ Res Public Health. 2016. PMID: 27706089 Free PMC article.
-
The Mortality Effect of Apparent Temperature: A Multi-City Study in Asia.Int J Environ Res Public Health. 2021 Apr 28;18(9):4675. doi: 10.3390/ijerph18094675. Int J Environ Res Public Health. 2021. PMID: 33924779 Free PMC article.
-
Inequitable Spatial and Temporal Patterns in the Distribution of Multiple Environmental Risks and Benefits in Metro Vancouver.Geohealth. 2024 Dec 19;8(12):e2024GH001157. doi: 10.1029/2024GH001157. eCollection 2024 Dec. Geohealth. 2024. PMID: 39712528 Free PMC article.
-
A Spatial Framework to Map Heat Health Risks at Multiple Scales.Int J Environ Res Public Health. 2015 Dec 18;12(12):16110-23. doi: 10.3390/ijerph121215046. Int J Environ Res Public Health. 2015. PMID: 26694445 Free PMC article.
-
Overheated and Understudied: A Scoping Review of Heat-Related Health Impacts in the Arabian Peninsula.Geohealth. 2025 Jun 30;9(7):e2024GH001277. doi: 10.1029/2024GH001277. eCollection 2025 Jul. Geohealth. 2025. PMID: 40599759 Free PMC article. Review.
References
-
- Barnett AG, Tong S, Clements AC. What measure of temperature is the best predictor of mortality? Environ Research. 2010;110(6):604–611. - PubMed
-
- Breiman L. Random forests. Mach Learn. 2001;45(1):5–32.
-
- Faraway JJ. Extending the Linear Model with R: Generalized Linear, Mixed Effects and Nonparametric Regression Models. Boca Raton, FL: Chapman & Hall/CRC; 2006.
Publication types
MeSH terms
Grants and funding
LinkOut - more resources
Full Text Sources
Other Literature Sources
