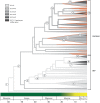
C4 photosynthesis promoted species diversification during the Miocene grassland expansion
- PMID: 24835188
- PMCID: PMC4023962
- DOI: 10.1371/journal.pone.0097722
C4 photosynthesis promoted species diversification during the Miocene grassland expansion
Erratum in
- PLoS One. 2014;9(8):e105923
Abstract
Identifying how organismal attributes and environmental change affect lineage diversification is essential to our understanding of biodiversity. With the largest phylogeny yet compiled for grasses, we present an example of a key physiological innovation that promoted high diversification rates. C4 photosynthesis, a complex suite of traits that improves photosynthetic efficiency under conditions of drought, high temperatures, and low atmospheric CO2, has evolved repeatedly in one lineage of grasses and was consistently associated with elevated diversification rates. In most cases there was a significant lag time between the origin of the pathway and subsequent radiations, suggesting that the 'C4 effect' is complex and derives from the interplay of the C4 syndrome with other factors. We also identified comparable radiations occurring during the same time period in C3 Pooid grasses, a diverse, cold-adapted grassland lineage that has never evolved C4 photosynthesis. The mid to late Miocene was an especially important period of both C3 and C4 grass diversification, coincident with the global development of extensive, open biomes in both warm and cool climates. As is likely true for most "key innovations", the C4 effect is context dependent and only relevant within a particular organismal background and when particular ecological opportunities became available.
Conflict of interest statement
Figures


Similar articles
-
Global grass (Poaceae) success underpinned by traits facilitating colonization, persistence and habitat transformation.Biol Rev Camb Philos Soc. 2018 May;93(2):1125-1144. doi: 10.1111/brv.12388. Epub 2017 Dec 12. Biol Rev Camb Philos Soc. 2018. PMID: 29230921 Review.
-
C4 photosynthesis evolved in warm climates but promoted migration to cooler ones.Ecol Lett. 2018 Mar;21(3):376-383. doi: 10.1111/ele.12905. Epub 2018 Jan 10. Ecol Lett. 2018. PMID: 29318753
-
Oligocene CO2 decline promoted C4 photosynthesis in grasses.Curr Biol. 2008 Jan 8;18(1):37-43. doi: 10.1016/j.cub.2007.11.058. Epub 2007 Dec 20. Curr Biol. 2008. PMID: 18160293
-
High silicon concentrations in grasses are linked to environmental conditions and not associated with C4 photosynthesis.Glob Chang Biol. 2020 Dec;26(12):7128-7143. doi: 10.1111/gcb.15343. Epub 2020 Oct 12. Glob Chang Biol. 2020. PMID: 32897634
-
Photosynthetic diversity meets biodiversity: the C4 plant example.J Plant Physiol. 2015 Jan 1;172:104-19. doi: 10.1016/j.jplph.2014.07.024. Epub 2014 Sep 4. J Plant Physiol. 2015. PMID: 25264020 Review.
Cited by
-
The Amount of Nitrogen Used for Photosynthesis Modulates Molecular Evolution in Plants.Mol Biol Evol. 2018 Jul 1;35(7):1616-1625. doi: 10.1093/molbev/msy043. Mol Biol Evol. 2018. PMID: 29684170 Free PMC article.
-
AnnotationBustR: an R package to extract subsequences from GenBank annotations.PeerJ. 2018 Jul 3;6:e5179. doi: 10.7717/peerj.5179. eCollection 2018. PeerJ. 2018. PMID: 30002984 Free PMC article.
-
Climate change is projected to outpace rates of niche change in grasses.Biol Lett. 2016 Sep;12(9):20160368. doi: 10.1098/rsbl.2016.0368. Biol Lett. 2016. PMID: 27677813 Free PMC article.
-
Phylotranscriptomics Resolves the Phylogeny of Pooideae and Uncovers Factors for Their Adaptive Evolution.Mol Biol Evol. 2022 Feb 3;39(2):msac026. doi: 10.1093/molbev/msac026. Mol Biol Evol. 2022. PMID: 35134207 Free PMC article.
-
The role of plants in the formation of species-specific features in grass flies (Diptera, Chloropidae, Meromyza).Biodivers Data J. 2021 Dec 29;9:e78017. doi: 10.3897/BDJ.9.e78017. eCollection 2021. Biodivers Data J. 2021. PMID: 35002370 Free PMC article.
References
-
- Ehleringer JR, Cerling TE, Helliker BR (1997) C4 photosynthesis, atmospheric CO2 and climate. Oecologia 112: 285–299. - PubMed
-
- Edwards EJ, Osborne CP, Strömberg CAE, Smith SA (2010) C4 Grasses Consortium. The origins of C4 grasslands: integrating evolutionary and ecosystem science. Science 328: 587–591. - PubMed
-
- Still CJ, Berry JA, Collatz GJ, DeFries RS (2003) Global distribution of C3 and C4 vegetation: carbon cycle implecation. Global Biogeochemical Cyc 17: 1006–1021.
-
- Sage RF, Sage TL, Kocacinar F (2012) Photorespiration and the evolution of C4 photosynthesis. Annu. Rev. Plant Biol 63: 19–47. - PubMed
-
- Clark LG, Zhang WP, Wendel JF (1995) A phylogeny of the grass family (Poaceae) based on ndhF sequence data. Syst. Biol 20(4): 436–460.
Publication types
MeSH terms
Substances
LinkOut - more resources
Full Text Sources
Other Literature Sources
Research Materials
Miscellaneous

