. 2014 May 16;9(5):e97060.
doi: 10.1371/journal.pone.0097060. eCollection 2014.

Corticotrophin-Releasing Factor (CRF) and the urocortins are potent regulators of the inflammatory phenotype of human and mouse white adipocytes and the differentiation of mouse 3T3L1 pre-adipocytes

Affiliations

Corticotrophin-Releasing Factor (CRF) and the urocortins are potent regulators of the inflammatory phenotype of human and mouse white adipocytes and the differentiation of mouse 3T3L1 pre-adipocytes

Eirini Dermitzaki et al. PLoS One. .

Abstract

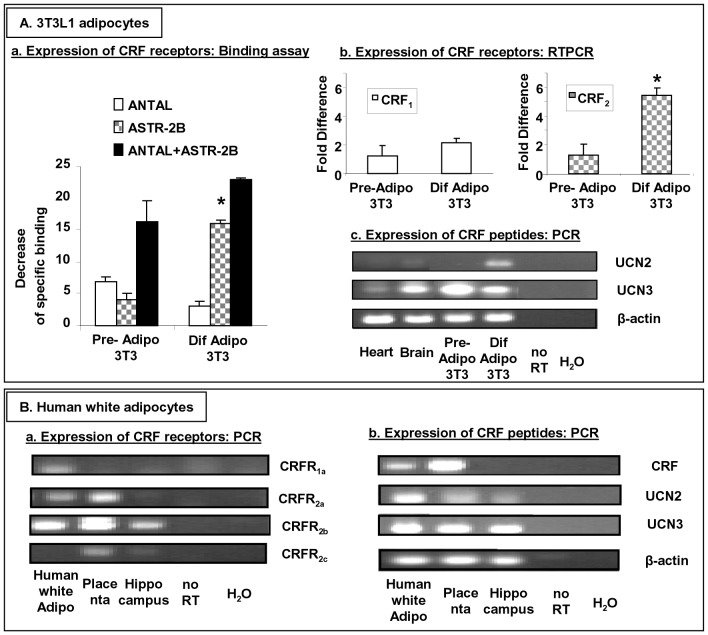
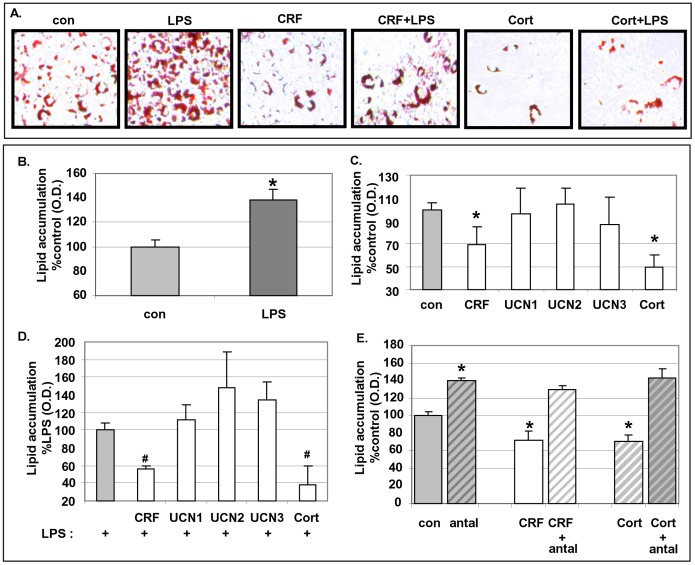
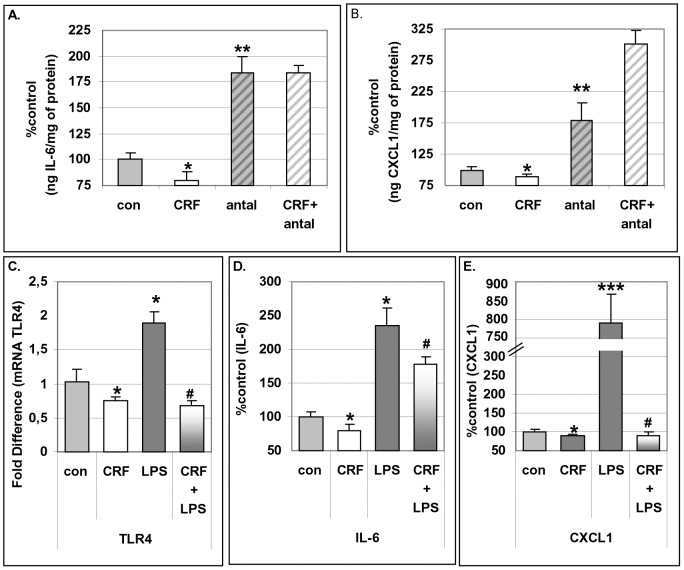
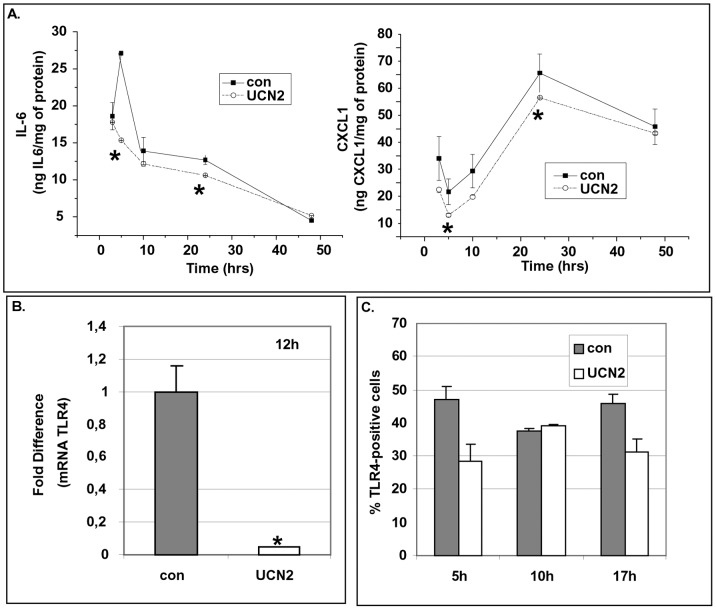
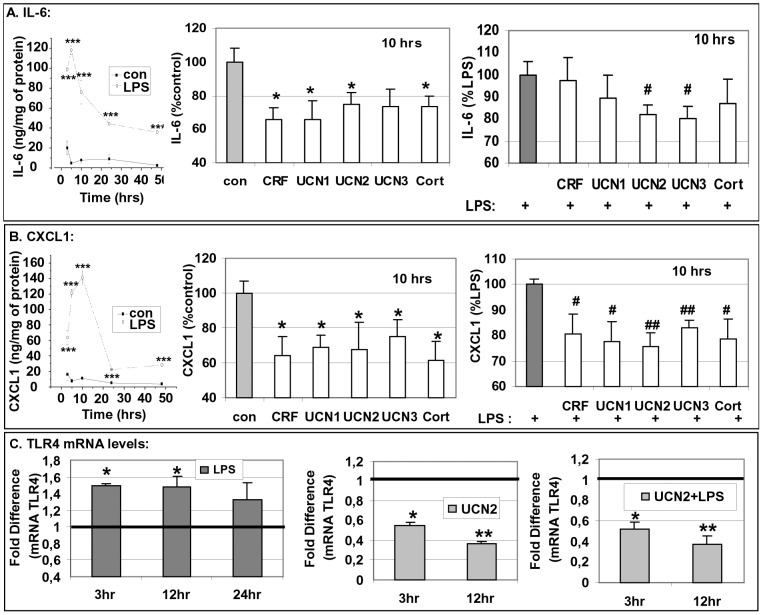
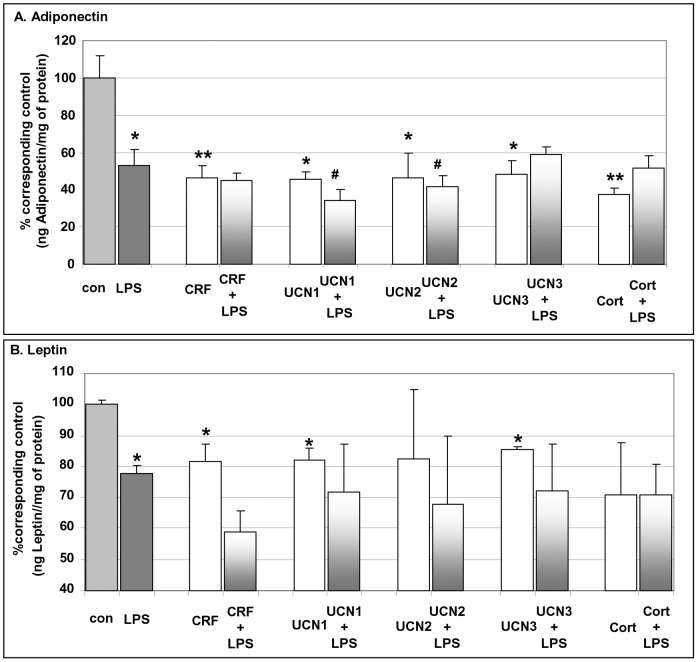
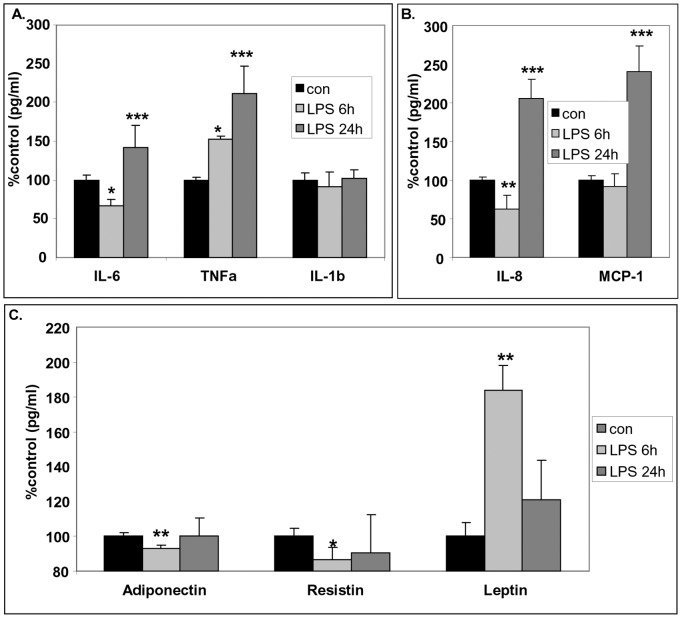
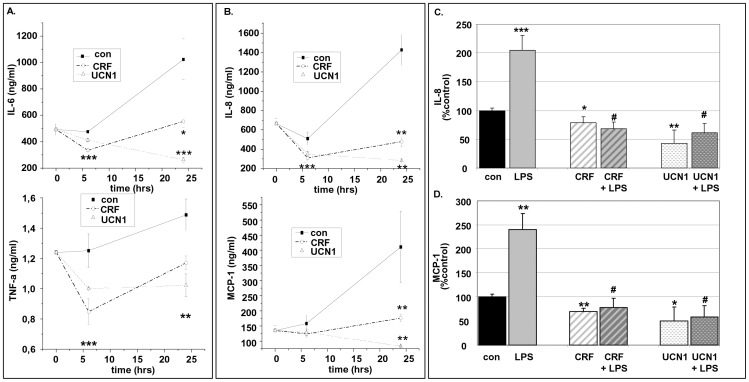
Chronic activation of innate immunity takes place in obesity and initiated by the hypertrophic adipocytes which obtain a pro-inflammatory phenotype. The corticotrophin-releasing factor (CRF) family of neuropeptides and their receptors (CRF1 and CRF2) affect stress response and innate immunity. Adipose tissue expresses a complete CRF system. The aim of this study was to examine the role of CRF neuropeptides in the immune phenotype of adipocytes assessed by their expression of the toll-like receptor-4 (TLR4), the production of inflammatory cytokines IL-6, TNF-α and IL-1β, chemokines IL-8, monocyte attractant protein-1 (MCP-1) and of the adipokines adiponectin, resistin and leptin. Our data are as follows: (a) CRF, UCN2 and UCN3 are expressed in human white adipocytes as well as CRFR1a, CRFR2a and CRFR2b but not CRFR2c. 3T3L1 pre-adipocytes and differentiated adipocytes expressed both CRF1 and CRF2 receptors and UCN3, while UCN2 was detected only in differentiated adipocytes. CRF2 was up-regulated in mouse mature adipocytes. (b) CRF1 agonists suppressed media- and LPS-induced pre-adipocyte differentiation while CRF2 receptor agonists had no effect. (c) In mouse pre-adipocytes, CRF2 agonists suppressed TLR4 expression and the production of IL-6, CXCL1 and adiponectin while CRF1 agonists had no effect. (d) In mature mouse adipocytes LPS induced IL-6 and CXCL1 production and suppressed leptin. (e) In human visceral adipocytes LPS induced IL-6, TNF-α, IL-8, MCP-1 and leptin production and suppressed adiponectin and resistin. (f) In mouse mature adipocytes CRF1 and CRF2 agonists suppressed basal and LPS-induced production of inflammatory cytokines, TLR4 expression and adiponectin production, while in human visceral adipocytes CRF and UCN1 suppressed basal and LPS-induced IL-6, TNF-α, IL-8 and MCP-1 production. In conclusion, the effects of the activation of CRF1 and CRF2 may be significant in ameliorating the pro-inflammatory activity of adipocytes in obesity.


Conflict of interest statement

Competing Interests: The authors have declared that no competing interests exist.

Figures

Figure 1
Figure 1. Expression of CRF receptors and peptides in 3T3L1 pre-adipocytes, differentiated adipocytes and human primary white adipocytes.
Panel A, (a), Cells were exposed to antalarmin (a CRF1 receptor antagonist) and/or astressin-2B (a CRF2 receptor antagonist) and the decrease of specific binding activity was measured. Data are expressed as the decrease of specific binding (mean±SE, n = 4 of two independent experiments) and *p<0.05 denotes significant statistical difference between the levels of CRF2 expressed in pre-adipocytes compared to the levels of CRF2 expressed in differentiated adipocytes; (b), The mRNA levels of CRF1 and CRF2 was measured in 3T3L1 pre-adipocytes and differentiated adipocytes by RT-PCR. Data are expressed as the fold difference of the mRNA levels of CRF1 or CRF2 expressed in pre-adipocytes (mean±SE, n = 4 of two independent experiments) and *p<0.05 denotes significant statistical difference between the levels of CRF2 expressed in differentiated adipocytes compared to the levels of CRF2 expressed in pre-adipocytes; (c), The mRNA levels of UCN2 and UCN3 were measured by PCR in mouse samples. Panel B, The mRNA levels of CRF receptor isoforms (column a) and CRF peptides (column b) were measured in human samples. Beta-Actin was used for control.
Figure 2
Figure 2. Effect of CRF agonists on the differentiation process of 3T3L1 cells.
Pre-adipocytes were exposed to CRF peptides and/or LPS during the differentiation period and stained with Oil-Red-O. Panel A, The accumulation of lipid droplets were visualized under a microscope; Panels B, C and D, The degree of differentiation was measured as the intensity of the absorbance read at 595 nm. Panel E, The accumulation of lipid droplets of cells pre-exposed to antalarmin (10−6 M) and to CRF or Cortagine at 10−8 M was measured as the intensity of the absorbance read at 595 nm. Data are expressed as percentage change compared with control values (Panels B, C, E) or compared with LPS (Panel D) (mean±SE, n = 8 of three independent experiments). *p<0.05 depicts the statistical significant difference from cells exposed only to vehicles, while #p<0.05 depicts the statistical significant difference from cells exposed to LPS alone.
Figure 3
Figure 3. Effect of CRF on TLR4 and interleukins during differentiation of 3T3L1.
Pre-adipocytes were cultured in differentiating media supplemented with CRF at 10−8M, pre-treated with antalarmin at 10−6 M and the production of IL-6 and CXCL1 was measured by ELISA (Panels A, B). Pre-adipocytes were cultured in differentiating media supplemented with CRF at 10−8 M plus/minus LPS (10 ng/ml) and the expression of TLR4 was measured by RT-PCR (Panel C) and the production of IL-6 and CXCL1 (Panels D, E) was measured by ELISA. Data are expressed as percentage change compared with control values (mean±SE, n = 10 of five independent experiments). *p<0.05, **p<0.01, ***p<0.001 depict the statistical significant difference from cells exposed only to vehicles, while #p<0.05 depicts the statistical significant difference from cells exposed to LPS alone.
Figure 4
Figure 4. UCN2 affects the production of interleukins and the expression of TLR4 by pre-adipocytes.
Pre-adipocytes were exposed to UCN2 at 10−8M and the production of interleukins was measured by ELISA (Panel A), the TLR4 mRNA levels were measured by RT-PCR (Panel B) and TLR4 protein levels were measured by FACS analysis (Panel C) at several time intervals. Data are expressed as mean±SE, n = 6 of three independent experiments. *p<0.05 depicts the statistical significant difference from cells exposed only to vehicles.
Figure 5
Figure 5. CRF agonists and LPS differentially regulate TLR4 expression and interleukins production by mouse mature adipocytes.
Mature adipocytes were exposed to CRF peptides (CRF, UCN1, UCN2, UCN3, Cortagine) all at 10−8M plus/minus LPS (10 ng/ml) and the production of IL-6 (Panel A), CXCL1 (Panel B) was measured. Data are expressed as mean±SE, n = 10 of five independent experiments. *p<0.05, **p<0.01 and ***p<0.001 depict the statistical significant difference from cells exposed only to vehicles, while #p<0.05, ##p<0.01 depict the statistical significant difference from cells exposed to LPS alone.
Figure 6
Figure 6. CRF agonists and LPS affect the release of adipokines by differentiating adipocytes.
Differentiating adipocytes were exposed to CRF peptides (CRF, UCN1, UCN2, UCN3, Cortagine) all at 10−8 M plus/minus LPS (10 ng/ml) and the release of adiponectin (Panel A) or leptin (Panel B) was measured. Data are expressed as mean±SE, n = 10 of five independent experiments. *p<0.05, **p<0.01 depict the statistical significant difference from cells exposed only to vehicles, while #p<0.05 depicts the statistical significant difference from cells exposed to LPS alone.
Figure 7
Figure 7. Time-dependent effect of LPS in the metabolic and inflammatory components of human white adipocytes.
Cells were exposed to 10/ml LPS for 6h or 24 h and the release of IL-6, TNF-α, IL-1b (Panel A), IL-8, MCP-1 (Panel B), adiponectin, resistin, leptin (Panel C) were measured. Data are expressed as mean±SE, n = 6 of three independent experiments. *p<0.05, **p<0.01 and ***p<0.001 depict the statistical significant difference from cells exposed only to vehicles.
Figure 8
Figure 8. CRF and UCN1 down-regulate the basal production of interleukins and chemokines and the LPS-induced pro-inflammatory effect in human white adipocytes.
Cells were exposed to CRF or UCN1 both at (10−8 M) for different time intervals and the release of IL-6, TNF-α (Panel A), IL-8 and MCP-1 (Panel B) was measured. Panel C, Human white adipocytes were exposed to CRF, UCN1 both at (10−8 M) and/or LPS (10 ng/ml) for 24 hrs and the production of IL-8 and MCP-1 was measured. Data are expressed as mean±SE, n = 6 of three independent experiments. *p<0.05, **p<0.01 and ***p<0.001 depict the statistical significant difference from cells exposed only to vehicles, while #p<0.05 depicts the statistical significant difference from cells exposed to LPS alone.

Similar articles

Cited by

References

    1. Tsatsanis C, Androulidaki A, Alissafi T, Charalampopoulos I, Dermitzaki E, et al. (2006) Corticotropin-releasing factor and the urocortins induce the expression of TLR4 in macrophages via activation of the transcription factors PU.1 and AP-1. J Immunol 176: 1869–1877. - PubMed
    1. Tsatsanis C, Androulidaki A, Dermitzaki E, Gravanis A, Margioris AN (2007) Corticotropin releasing factor receptor 1 (CRF1) and CRF2 agonists exert an anti-inflammatory effect during the early phase of inflammation suppressing LPS-induced TNF-αlpha release from macrophages via induction of COX-2 and PGE2. J Cell Physiol 210: 774–783. - PubMed
    1. Charalampopoulos I, Androulidaki A, Minas V, Chatzaki E, Tsatsanis C, et al. (2006) Neuropeptide urocortin and its receptors are expressed in rat Kupffer cells. Neuroendocrinology 84: 49–57. - PubMed
    1. Tsatsanis C, Androulidaki A, Dermitzaki E, Charalampopoulos I, Spiess J, et al. (2005) Urocortin 1 and Urocortin 2 induce macrophage apoptosis via CRFR2. FEBS Lett 579: 4259–4264. - PubMed
    1. Trayhurn P, Wood IS (2005) Signalling role of adipose tissue: adipokines and inflammation in obesity. Biochem Soc Trans 33: 1078–1081. - PubMed

Publication types

MeSH terms