

Modulation of habitat-based conservation plans by fishery opportunity costs: a New Caledonia case study using fine-scale catch data
- PMID: 24835216
- PMCID: PMC4024024
- DOI: 10.1371/journal.pone.0097409
Modulation of habitat-based conservation plans by fishery opportunity costs: a New Caledonia case study using fine-scale catch data
Abstract
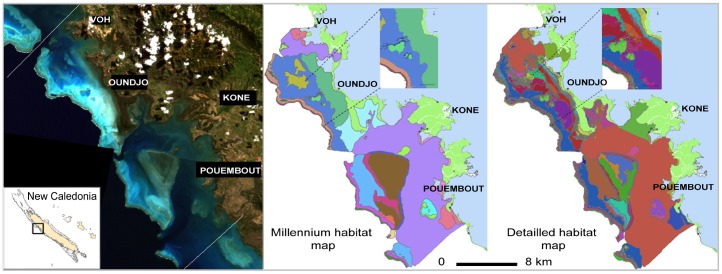
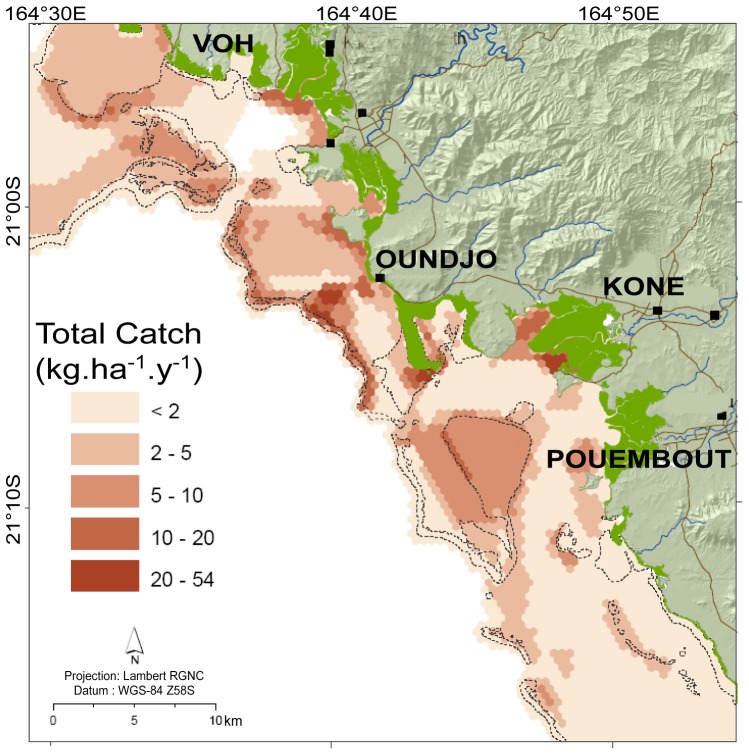
Numerous threats impact coral reefs and conservation actions are urgently needed. Fast production of marine habitat maps promotes the use of habitat-only conservation plans, where a given percentage of the area of each habitat is set as conservation objectives. However, marine reserves can impact access to fishing grounds and generate opportunity costs for fishers that need to be minimized. In New Caledonia (Southwest Pacific), we used fine-scale fishery catch maps to define nineteen opportunity costs layers (expressed as biomass catch loss) considering i) total catches, ii) target fish families, iii) local marine tenure, and iv) gear type. The expected lower impacts on fishery catch when using the different cost constraints were ranked according to effectiveness in decreasing the costs generated by the habitat-only scenarios. The exercise was done for two habitat maps with different thematic richness. In most cases, habitat conservation objectives remained achievable, but effectiveness varied widely between scenarios and between habitat maps. The results provide practical guidelines for coral reef conservation and management. Habitat-only scenarios can be used to initiate conservation projects with stakeholders but the costs induced by such scenarios can be lowered by up to 50-60% when detailed exhaustive fishery data are used. When using partial data, the gain would be only in the 15-25% range. The best compromises are achieved when using local data.
Conflict of interest statement
Figures


Similar articles
-
Recovery potential of the world's coral reef fishes.Nature. 2015 Apr 16;520(7547):341-4. doi: 10.1038/nature14358. Epub 2015 Apr 8. Nature. 2015. PMID: 25855298
-
Behavioral and environmental influences on fishing rewards and the outcomes of alternative management scenarios for large tropical rivers.J Environ Manage. 2013 Oct 15;128:274-82. doi: 10.1016/j.jenvman.2013.05.037. Epub 2013 Jun 10. J Environ Manage. 2013. PMID: 23764509
-
Synergistic Effects of Marine Reserves and Harvest Controls on the Abundance and Catch Dynamics of a Coral Reef Fishery.Curr Biol. 2016 Jun 20;26(12):1543-1548. doi: 10.1016/j.cub.2016.04.022. Epub 2016 May 12. Curr Biol. 2016. PMID: 27185553
-
Larval dispersal and movement patterns of coral reef fishes, and implications for marine reserve network design.Biol Rev Camb Philos Soc. 2015 Nov;90(4):1215-47. doi: 10.1111/brv.12155. Epub 2014 Nov 25. Biol Rev Camb Philos Soc. 2015. PMID: 25423947 Review.
-
Unlocking the Potential of Marine Sidestreams in the Blue Economy: Lessons Learned from the EcoeFISHent Project on Fish Collagen.Mar Biotechnol (NY). 2025 Mar 13;27(2):63. doi: 10.1007/s10126-025-10438-9. Mar Biotechnol (NY). 2025. PMID: 40080223 Free PMC article. Review.
Cited by
-
Sympathy for the Devil: Detailing the Effects of Planning-Unit Size, Thematic Resolution of Reef Classes, and Socioeconomic Costs on Spatial Priorities for Marine Conservation.PLoS One. 2016 Nov 9;11(11):e0164869. doi: 10.1371/journal.pone.0164869. eCollection 2016. PLoS One. 2016. PMID: 27829042 Free PMC article.
References
-
- Dalleau M, Andréfouët S, Wabnitz CCC, Payri C, Wantiez L, et al. (2010) F (2010) Use of Habitats as Surrogates of Biodiversity for Efficient Coral Reef Conservation Planning in Pacific Ocean Islands. Conservation Biology 24: 541–552. - PubMed
-
- Andréfouët S, Chagnaud N, Chauvin C, Kranenburg C (2008) Atlas des récifs coralliens de France Outre-Mer. Centre IRD de Nouméa, Nouméa, Nouvelle-Calédonie. 153 p.
-
- Richardson E, Kaiser M, Edwards-Jones G, Possingham H (2006) Sensitivity of marine-reserve design to the spatial resolution of socioeconomic data. Conservation Biology 20: 1191–1202. - PubMed
-
- Ban NC, Hansen GJA, Jones M, Vincent ACJ (2009) Systematic marine conservation planning in data-poor regions: Socioeconomic data is essential. Marine Policy 33: 794–800.
Publication types
MeSH terms
LinkOut - more resources
Full Text Sources
Other Literature Sources
