. 2014 Jun 2;24(11):1234-40.
doi: 10.1016/j.cub.2014.04.009. Epub 2014 May 15.

A rhodopsin-guanylyl cyclase gene fusion functions in visual perception in a fungus

Affiliations

A rhodopsin-guanylyl cyclase gene fusion functions in visual perception in a fungus

Gabriela M Avelar et al. Curr Biol. .

Abstract

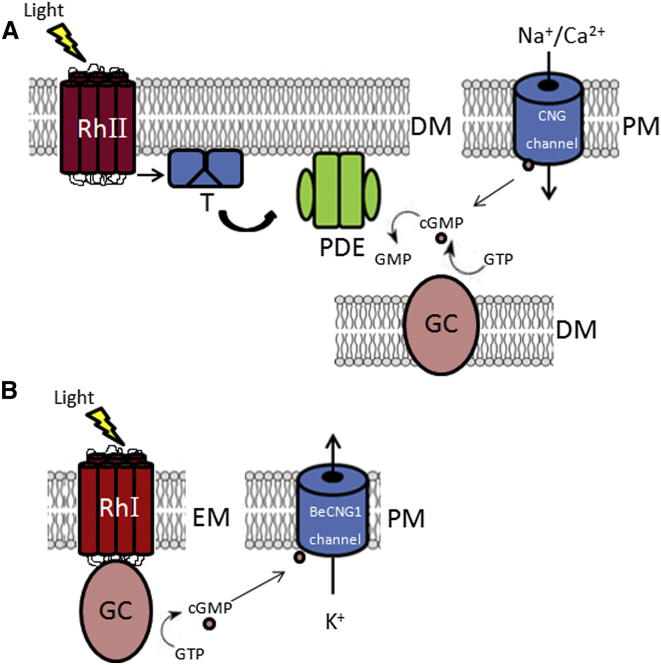
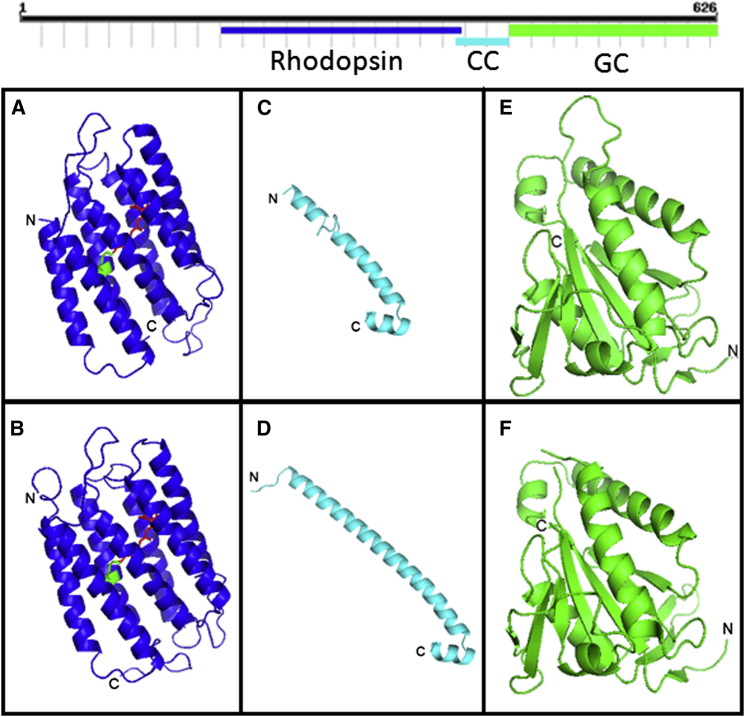
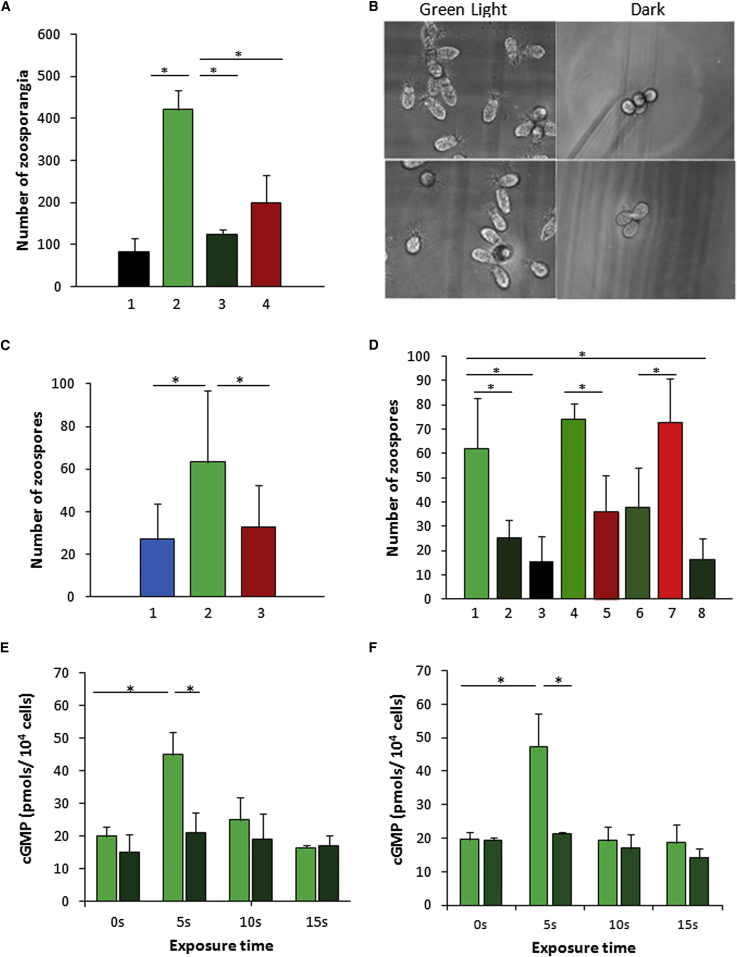
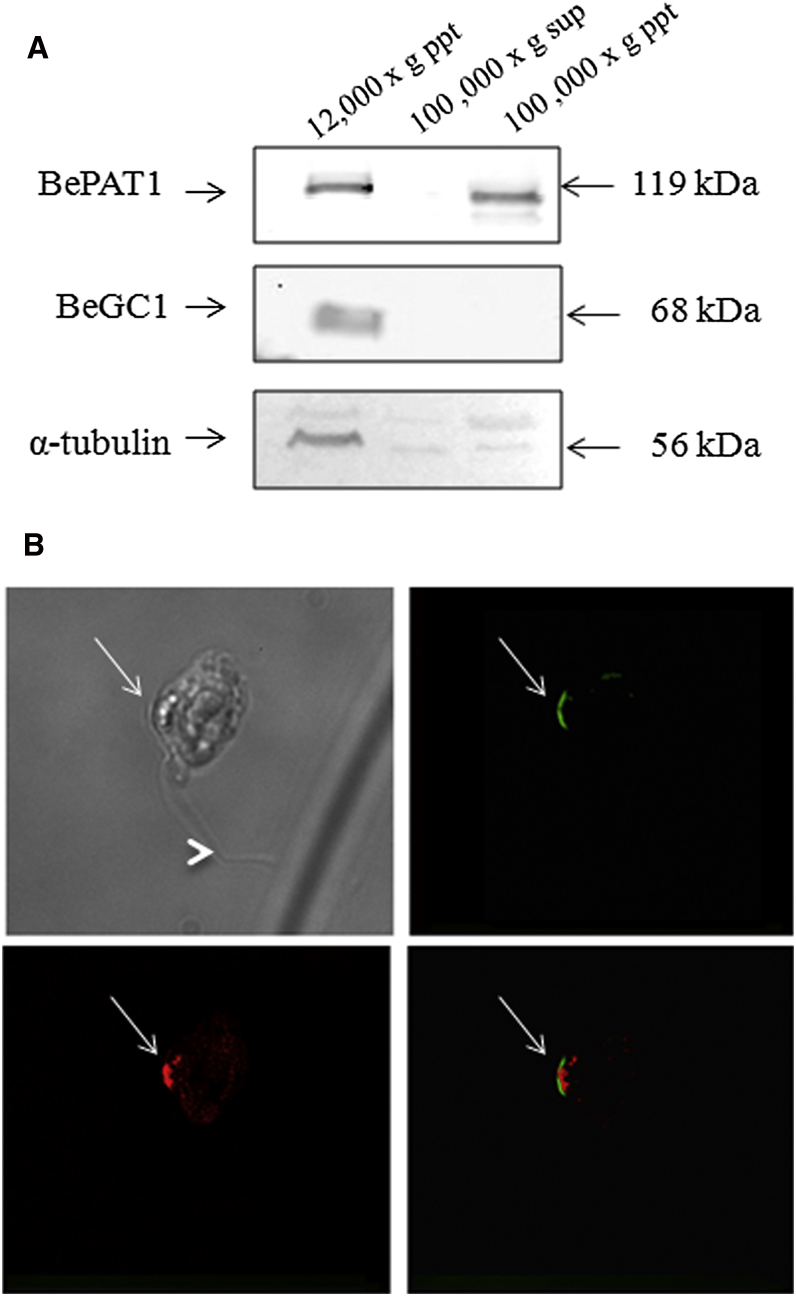
Sensing light is the fundamental property of visual systems, with vision in animals being based almost exclusively on opsin photopigments [1]. Rhodopsin also acts as a photoreceptor linked to phototaxis in green algae [2, 3] and has been implicated by chemical means as a light sensor in the flagellated swimming zoospores of the fungus Allomyces reticulatus [4]; however, the signaling mechanism in these fungi remains unknown. Here we use a combination of genome sequencing and molecular inhibition experiments with light-sensing phenotype studies to examine the signaling pathway involved in visual perception in the closely related fungus Blastocladiella emersonii. Our data show that in these fungi, light perception is accomplished by the function of a novel gene fusion (BeGC1) of a type I (microbial) rhodopsin domain and guanylyl cyclase catalytic domain. Photobleaching of rhodopsin function prevents accumulation of cGMP levels and phototaxis of fungal zoospores exposed to green light, whereas inhibition of guanylyl cyclase activity negatively affects fungal phototaxis. Immunofluorescence microscopy localizes the BeGC1 protein to the external surface of the zoospore eyespot positioned close to the base of the swimming flagellum [4, 5], demonstrating this is a photoreceptive organelle composed of lipid droplets. Taken together, these data indicate that Blastocladiomycota fungi have a cGMP signaling pathway involved in phototaxis similar to the vertebrate vision-signaling cascade but composed of protein domain components arranged as a novel gene fusion architecture and of distant evolutionary ancestry to type II rhodopsins of animals.


Figures

Figure 1
Figure 1
Schematic Models of the Signaling Pathway of Vertebrate Rod Photoreceptor and Blastocladiella Zoospore Phototaxis (A) In the vertebrate visual signaling pathway, photoexcitation of the G protein-coupled rhodopsin receptor leads to activation of rod and cone heterotrimeric G protein transducin complex stimulating hydrolysis of cGMP [6]. The decrease in cGMP concentration leads to closure of cGMP-gated (CNG) channels, blockage of Na+ influx, and hyperpolarization of photoreceptor plasma membrane, leading to transmission of signal through synapses [6]. Reduction of CNG channel activity blocks Ca2+ influx, decreasing cytoplasmic calcium concentration in retinal photoreceptor outer segments (ROS) and leading to activation of guanylyl cyclases (ROS-GCs) by the now Ca2+-free GC-activating proteins (GCAPs) through acceleration of ROS-GC dimerization, thus restoring cGMP levels [7, 8]. (B) In the B. emersonii zoospore phototaxis transduction pathway, photoisomerization of rhodopsin in BeGC1 activates guanylyl cyclase activity, leading to the synthesis of cGMP from GTP. Cyclic GMP opens K+-selective BeCNG1 channels, thereby causing hyperpolarization of the plasma membrane. A putative opening of voltage-activated calcium channels could produce elevation of [Ca2+], which would interact with the flagellum altering the flagellar beat, as in Arbacia sperm [9]. RhI, type I rhodopsin; RhII, type II rhodopsin; GC, guanylyl cyclase; T, transducin; PDE, phosphodiesterase; EM, eyespot membrane; PM, plasma membrane; DM, disk membrane. See also Figure S4.
Figure 2
Figure 2
Structural Features of BeGC1 Protein Domains Constructed by Swiss-Model Homology-Based Approach (A and B) The BeGC1 rhodopsin domain structure in (A) is based on the crystal structure of Halobacterium salinarum type I rhodopsin [20] shown in (B), with the retinal denoted in red and the lysine of the Shiff base in green. (C and D) The structure of the coiled-coil domain, which links the rhodopsin domain to the GC domain on BeGC1, in (C) is based on the crystal structure of Rattus norvegicus soluble guanylyl cyclase CC domain [21] shown in (D). (E and F) The structure of BeGC1 guanylyl cyclase catalytic domain in (E) is based on the crystal structure of the catalytic domain of soluble guanylyl cyclase CYG12 from Chlamydomonas reinhardtii [22] shown in (F). See also Figures S1–S3.
Figure 3
Figure 3
Phototaxis of B. emersonii Zoospores Involves Rhodopsin and Guanylyl Cyclase Activity (A and B) Data of phototaxis assays in agar plates. The resulting vegetative cells found in the region of the plates exposed (column 2) or not (column 1) to green light (522 ± 17 nm; 4.4 mW/cm2) and preincubated (column 3) or not (column 2) with 500 μM hydroxylamine (HA) were visualized under a light microscope and cells were counted (A) and photographed (B). Vegetative cells were also counted in plates exposed to red light (633 ± 13 nm; 4.4 mW/cm2; column 4). Results are mean values of three biological replicates. (C) Phototaxis in microfluidic chamber. Data are from zoospores exposed to blue light (465 ± 25 nm; 67 μW/cm2; column 1), zoospores exposed to green light (565 ± 25 nm; 55 μW/cm2; column 2) and zoospores exposed to red light (620 ± 30 nm; 35 μW/cm2; column 3). (D) Phototaxis in microfluidic chamber with zoospores from growth with norflurazon. Zoospores from growth without (column 1) or with 10 μM (column 2) or 50 μM (column 3) norflurazon exposed to green light, zoospores from growth with 50 μM norflurazon reconstituted with 5 μM retinalA1 exposed to green light (565 ± 25 nm; 55 μW/cm2; column 4) or red light (620 ± 30 nm; 35 μW/cm2; column 5) or reconstituted with 5 μM retinalA2 exposed to green light (565 ± 25 nm; 55 μW/cm2; column 6) or red light (620 ± 30 nm; 35 μW/cm2; column 7), and zoospores from growth without norflurazon incubated with 10 μM of GC inhibitor LY83583 exposed to green light (565 ± 25 nm; 55 μW/cm2; column 8) are shown. Results are mean values of three biological replicates. (E) Changes in intracellular cGMP levels in zoospores upon green light irradiation. Levels of cGMP were determined before and after different times of zoospore exposure to green light (522 ± 17 nm; 4.4 mW/cm2) and in the absence (green rectangles) or presence (dark green rectangles) of 500 μM hydroxylamine. (F) Changes in cGMP levels after different times of irradiation with green light (522 ± 17 nm; 4.4 mW/cm2) of zoospores obtained in the presence of 50 μM norflurazon and incubated (green rectangles) or not incubated (dark green rectangles) with 5 μM retinalA1 to restore phototactic capacity. Data are mean values of three independent replicates. Error bars indicate the SE. Asterisks denote significant differences at p < 0.05.
Figure 4
Figure 4
Subcellular Localization of BeGC1 Protein (A) Western blot analysis of subcellular fractions of zoospore lysates obtained by differential centrifugation, as described in the Supplemental Experimental Procedures. Fractions were resolved through SDS-PAGE followed by western blotting and were developed using rabbit antisera against BeGC1, BePAT1, and α-tubulin, as well as the fluorescent CF680 Goat anti-rabbit IgG as a secondary antibody. The bound complexes were detected using the Odyssey Infrared Imaging System. (B) Localization of BeGC1 by immunofluorescence microscopy. Zoospores were fixed with 4% p-formaldehyde and 1% calcium chloride, permeabilized with PBS containing 0.1% Triton X-100, and incubated with rabbit anti-BeGC1 antiserum. The reactivity was developed with a specific goat anti-rabbit IgG antibody conjugated with Alexa-Fluor 488 (Molecular Probes). The lipid droplets of the eyespot were visualized with the lipid-specific fluorescent dye Nile Red. From top left to bottom right, the following are shown: zoospore under phase contrast (differential interference contrast image), BeGC1 (green), lipid droplets (red) of the eyespot, and a merge of BeGC1 and lipid droplets images. The arrows indicate the position of the eyespot apparatus, and the arrowhead shows the zoospore flagellum. The images shown are at 1000× magnification.

References

    1. Fain G.L., Hardie R., Laughlin S.B. Phototransduction and the evolution of photoreceptors. Curr. Biol. 2010;20:R114–R124. - PMC - PubMed
    1. Foster K.W., Saranak J., Patel N., Zarilli G., Okabe M., Kline T., Nakanishi K. A rhodopsin is the functional photoreceptor for phototaxis in the unicellular eukaryote Chlamydomonas. Nature. 1984;311:756–759. - PubMed
    1. Sineshchekov O.A., Jung K.H., Spudich J.L. Two rhodopsins mediate phototaxis to low- and high-intensity light in Chlamydomonas reinhardtii. Proc. Natl. Acad. Sci. USA. 2002;99:8689–8694. - PMC - PubMed
    1. Saranak J., Foster K.W. Rhodopsin guides fungal phototaxis. Nature. 1997;387:465–466. - PubMed
    1. Cantino E.C., Truesdell L.C. Organization and fine structure of the side body and its lipid sac in the zoospore of Blastocladiella emersonii. Mycologia. 1970;62:548–567. - PubMed

Publication types

MeSH terms