Randomized Controlled Trial
. 2014 Oct;121(10):1956-65.
doi: 10.1016/j.ophtha.2014.04.020. Epub 2014 May 15.

Comparison of optical coherence tomography assessments in the comparison of age-related macular degeneration treatments trials

Collaborators, Affiliations
Randomized Controlled Trial

Comparison of optical coherence tomography assessments in the comparison of age-related macular degeneration treatments trials

Francisco A Folgar et al. Ophthalmology. 2014 Oct.

Abstract

Objective: To determine agreement between spectral-domain (SD) and time-domain (TD) optical coherence tomography (OCT) image assessments by certified readers in eyes treated for neovascular age-related macular degeneration (AMD).

Design: Cross-sectional study within the Comparison of AMD Treatments Trials (CATT).

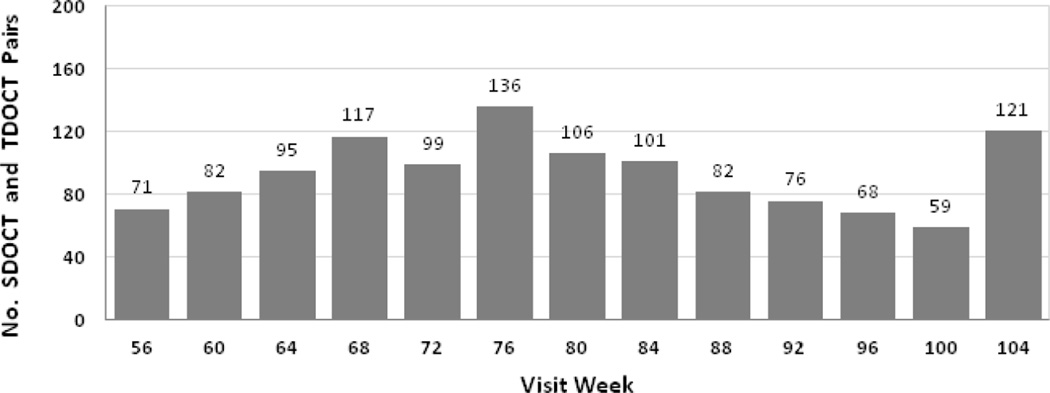
Participants: During year 2 of CATT, 1213 pairs of SD OCT and TD OCT scans were compared from a subset of 384 eyes.

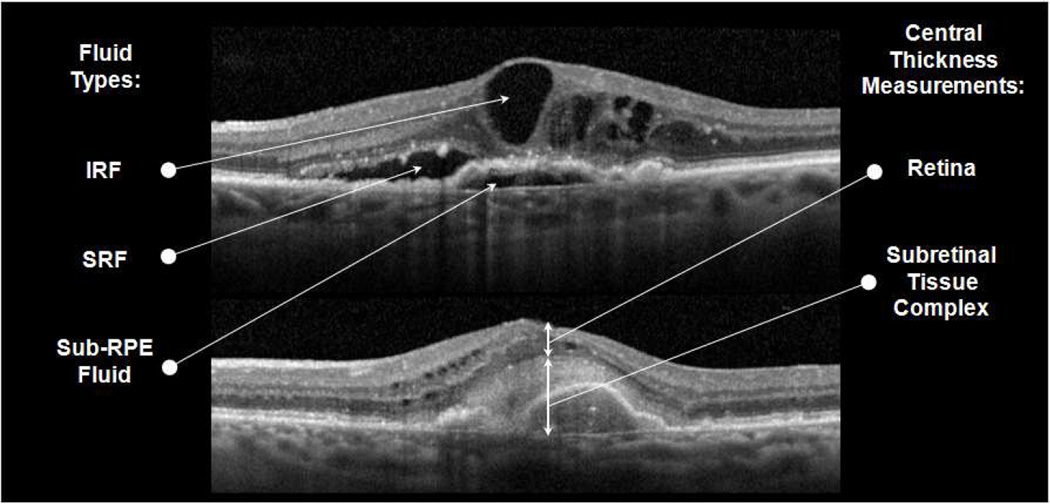
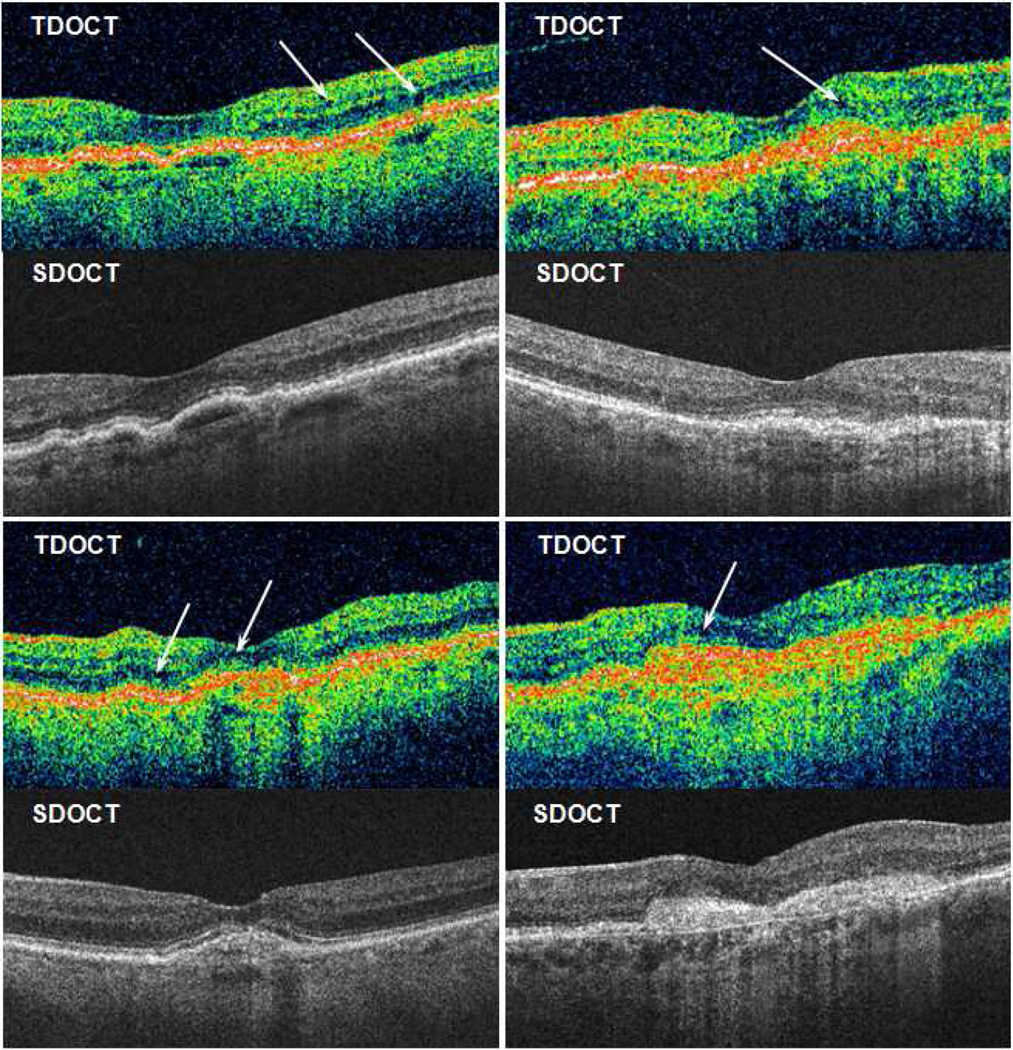
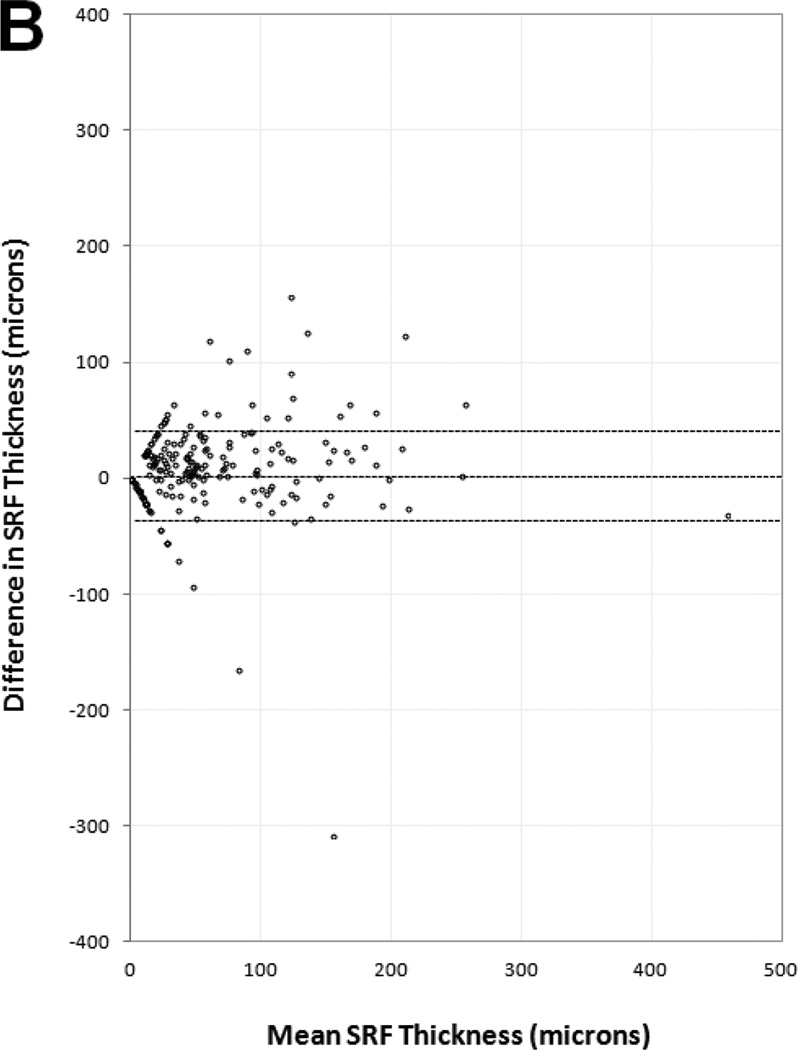
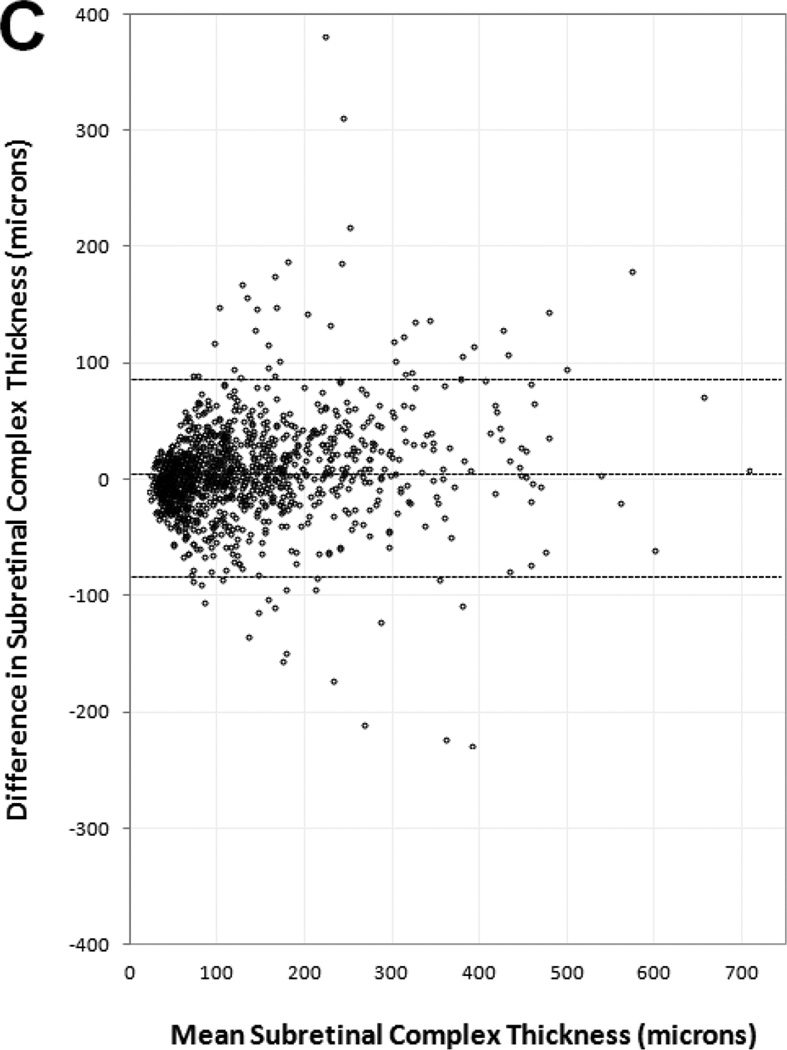
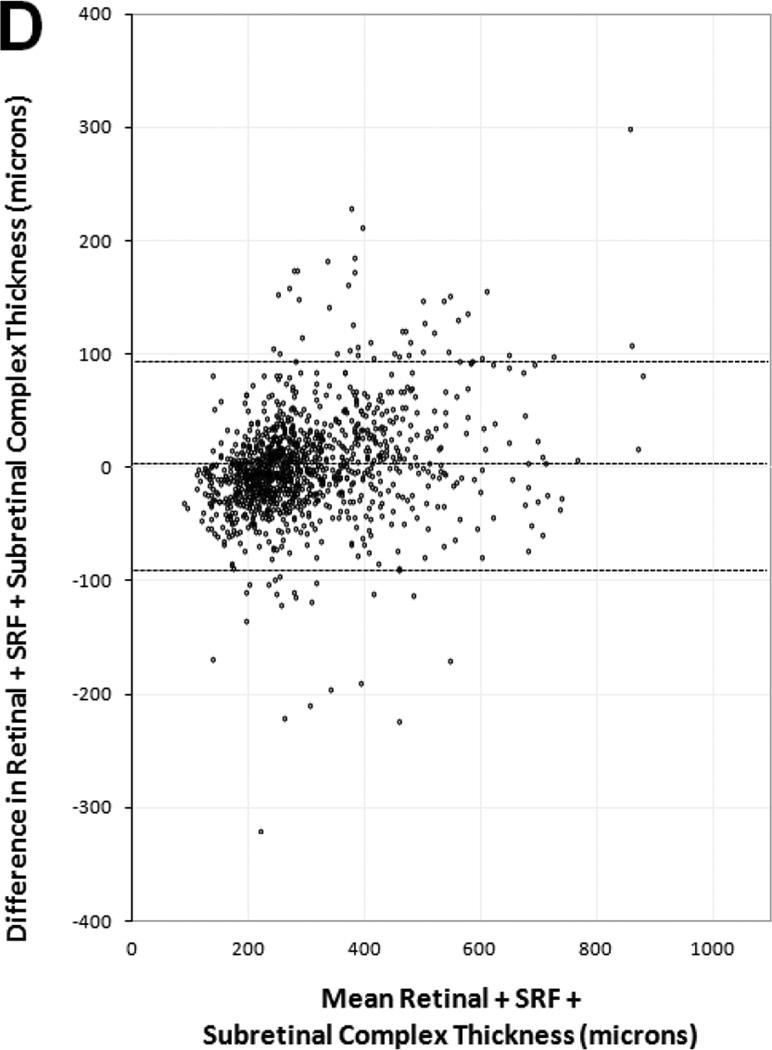
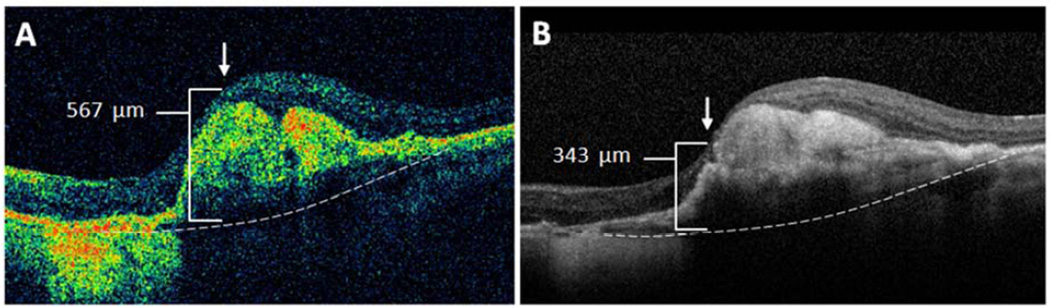
Methods: Masked readers independently graded OCT scans for presence of intraretinal fluid (IRF), subretinal fluid (SRF), and sub-retinal pigment epithelium (RPE) fluid and performed manual measurements of retinal, SRF, and subretinal tissue complex thicknesses at the foveal center.

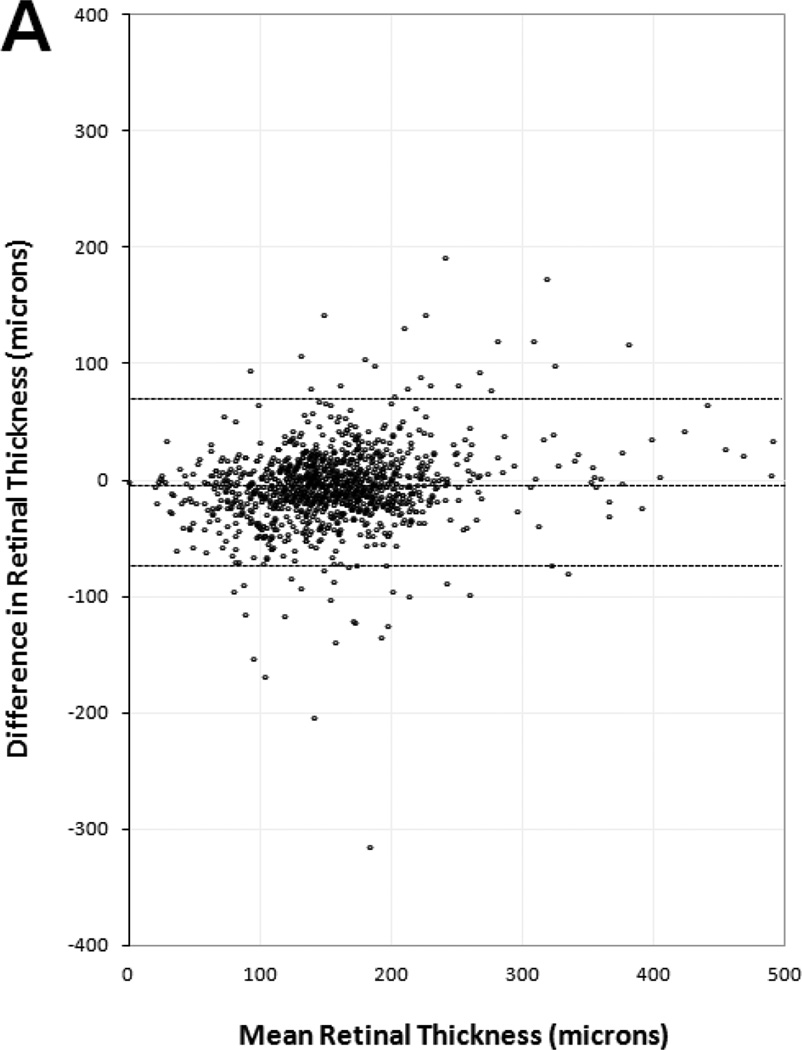
Main outcome measures: Presence of fluid was evaluated with percent agreement, κ coefficients with 95% confidence intervals (CIs), and McNemar tests. Thickness measurements were evaluated with mean difference (Δ) ±95% limits of agreement and intraclass correlation coefficients (ICCs) with 95% CIs.

Results: Between SD OCT and TD OCT, agreement on presence of any fluid was 82% (κ = 0.46; 95% CI, 0.40-0.52), with 5% more SD OCT scans demonstrating fluid (P<0.001). Agreement on presence of SRF was 87% and sub-RPE fluid was 80%, with more SD OCT scans demonstrating fluid (both P < 0.001). Agreement on IRF was 73% (κ = 0.47; 95% CI, 0.42-0.52), with 6% more TD OCT scans demonstrating fluid (P < 0.001). Between SD OCT and TD OCT, mean thickness of the retina was Δ = 5±67 μm, SRF was Δ = 1.5±35 μm, and subretinal tissue complex was Δ = 5±86 μm. Thickness measurements were reproducible for retina (ICC = 0.84; 95% CI, 0.83-0.86), SRF (ICC = 0.88; 95% CI, 0.86-0.89), and subretinal tissue complex (ICC = 0.91; 95% CI, 0.89-0.92), with ≤25-μm difference in these measurements in 71%, 94%, and 61% of paired scans, respectively.

Conclusions: Agreement on fluid presence and manual thickness measurements between paired scans from each OCT modality was moderate, providing a reasonable basis to compare CATT results with future SD OCT-based trials. Fluid was detected 5% more frequently with SD OCT, which may increase frequency of fluid-based treatment. Lower-resolution and artifactual interpretation of dark areas as cystoid edema may explain the greater frequency of IRF detected with TD OCT.

Trial registration: ClinicalTrials.gov NCT00593450.


Figures

Figure 1
Figure 1
Spectral domain optical coherence tomography scans showing intraretinal fluid (IRF), subretinal fluid (SRF), and sub-retinal pigment epithelium (RPE) fluid (top) and central foveal measurements of retinal thickness and subretinal tissue complex thickness, which includes subretinal highly reflective material and fibrovascular RPE detachment (bottom).
Figure 2
Figure 2
Distribution of spectral domain (SD) and time (TD) optical coherence tomography (OCT) scan pairs (n=1213 pairs) across all scheduled study visits in year 2 (weeks 56–104).
Figure 3
Figure 3
Four cases with time domain (TD) and spectral domain (SD) optical coherence tomography (OCT) performed at the same study visit. Arrows show subtle dark areas on TDOCT interpreted by readers as cystoid spaces with intraretinal fluid. Readers reported no intraretinal fluid on corresponding SDOCT scans.
Figure 4
Figure 4
Bland-Altman plots of spectral domain and time domain optical coherence tomography reader agreement for central foveal thickness measurements of (A) retina, (B) subretinal fluid, (C) subretinal tissue complex, and (D) total thickness of the retina, subretinal fluid, and subretinal tissue complex. Difference in thickness represents spectral domain optical coherence tomography (OCT) minus time domain OCT measurements on paired scans. Dotted lines represent mean difference and 95% limits of agreement.
Figure 4
Figure 4
Bland-Altman plots of spectral domain and time domain optical coherence tomography reader agreement for central foveal thickness measurements of (A) retina, (B) subretinal fluid, (C) subretinal tissue complex, and (D) total thickness of the retina, subretinal fluid, and subretinal tissue complex. Difference in thickness represents spectral domain optical coherence tomography (OCT) minus time domain OCT measurements on paired scans. Dotted lines represent mean difference and 95% limits of agreement.
Figure 5
Figure 5
Severe foveal deformation caused central foveal thickness measurement differences outside the 95% limits of agreement. In this case, a small difference of foveal center point placement (arrow) by readers using (A) time domain and (B) spectral domain optical coherence tomography produced a difference of 224 µm in total thickness (bracket) from internal limiting membrane to Bruch’s membrane (dotted line).

References

    1. CATT Research Group. Ranibizumab and bevacizumab for neovascular age-related macular degeneration. N Engl J Med. 2011;364:1897–1908. - PMC - PubMed
    1. Comparison of Age-related Macular Degeneration Treatments Trials (CATT) Research Group. Martin DF, Maguire MG, Fine SL, et al. Ranibizumab and bevacizumab for treatment of neovascular age-related macular degeneration: two-year results. Ophthalmology. 2012;119:1388–1398. - PMC - PubMed
    1. Hee MR, Baumal CR, Puliafito CA, et al. Optical coherence tomography of age-related macular degeneration and choroidal neovascularization. Ophthalmology. 1996;103:1260–1270. - PubMed
    1. Jaffe GJ, Caprioli J. Optical coherence tomography to detect and manage retinal disease and glaucoma. Am J Ophthalmol. 2004;137:156–169. - PubMed
    1. Chen TC, Cense B, Pierce MC, et al. Spectral domain optical coherence tomography: ultra-high speed, ultra-high resolution ophthalmic imaging. Arch Ophthalmol. 2005;123:1715–1720. - PubMed

Publication types

MeSH terms

Associated data