. 2014 Jun 12;7(5):1343-1352.
doi: 10.1016/j.celrep.2014.04.040. Epub 2014 May 15.

TET1-mediated hydroxymethylation facilitates hypoxic gene induction in neuroblastoma

Affiliations

TET1-mediated hydroxymethylation facilitates hypoxic gene induction in neuroblastoma

Christopher J Mariani et al. Cell Rep. .

Abstract

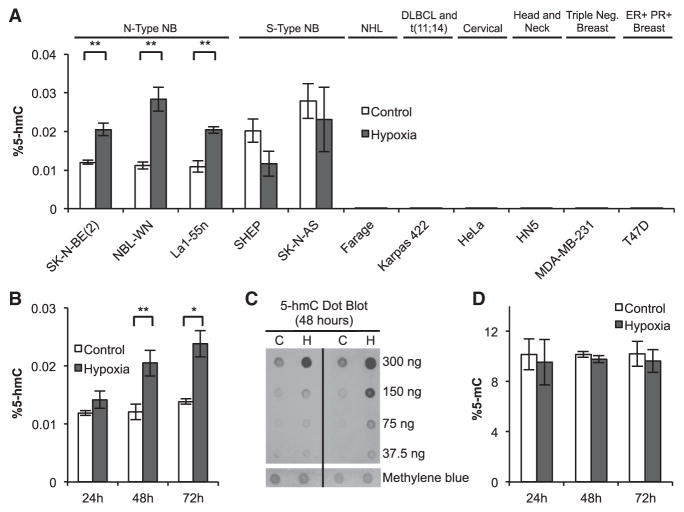
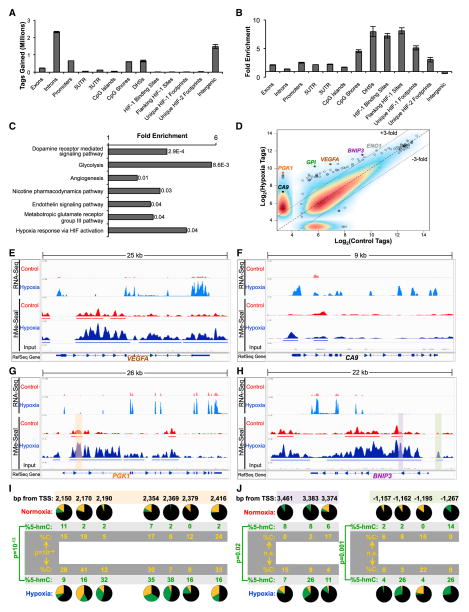
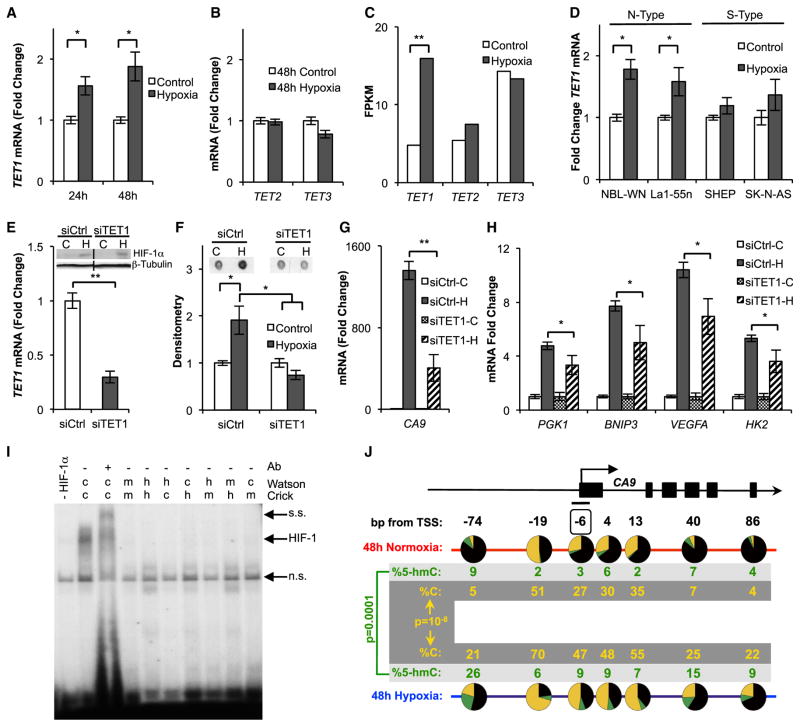
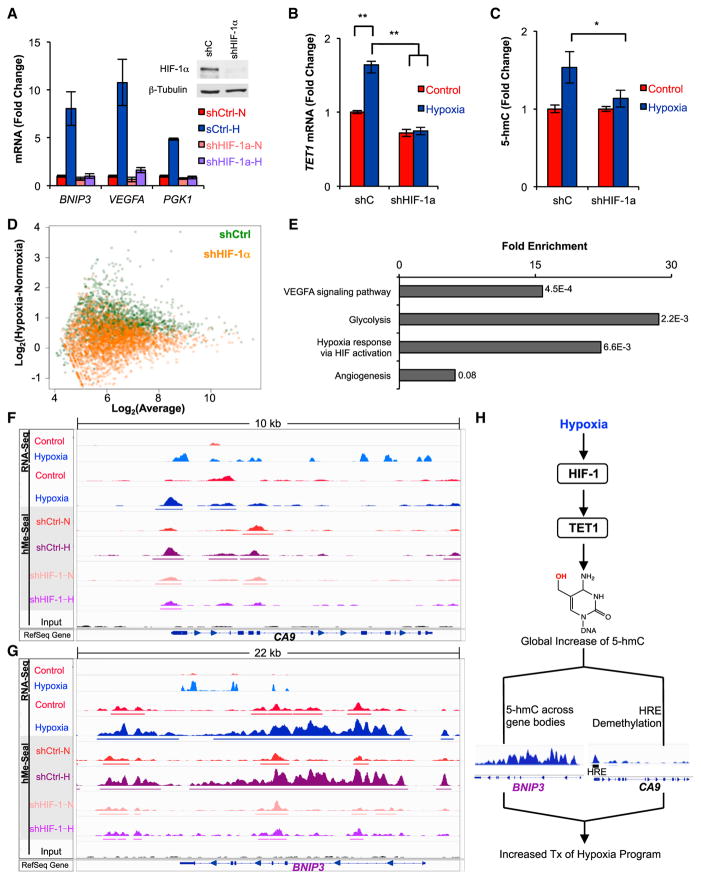
The ten-eleven-translocation 5-methylcytosine dioxygenase (TET) family of enzymes catalyzes the conversion of 5-methylcytosine (5-mC) to 5-hydroxymethylcytosine (5-hmC), a modified cytosine base that facilitates gene expression. Cells respond to hypoxia by inducing a transcriptional program regulated in part by oxygen-dependent dioxygenases that require Fe(II) and α-ketoglutarate. Given that the TET enzymes also require these cofactors, we hypothesized that the TETs regulate the hypoxia-induced transcriptional program. Here, we demonstrate that hypoxia increases global 5-hmC levels, with accumulation of 5-hmC density at canonical hypoxia response genes. A subset of 5-hmC gains colocalize with hypoxia response elements facilitating DNA demethylation and HIF binding. Hypoxia results in transcriptional activation of TET1, and full induction of hypoxia-responsive genes and global 5-hmC increases require TET1. Finally, we show that 5-hmC increases and TET1 upregulation in hypoxia are HIF-1 dependent. These findings establish TET1-mediated 5-hmC changes as an important epigenetic component of the hypoxic response.


Figures

Figure 1
Figure 1. Global 5-hmC Levels Increase in Hypoxia
(A) Quantitation of 5-hmC by HPLC-MS/MS in various cancer cell lines exposed to 48 hr of hypoxia (NB, neuroblastoma; NHL, non-Hodgkin lymphoma; DLBCL, diffuse large B cell lymphoma; ER, estrogen receptor; PR, progesterone receptor). Percentage 5-hmC is calculated relative to the sum of all cytosine species (n ≥ 3). (B) Quantitation of 5-hmC by HPLC-MS/MS in SK-N-BE(2) cells exposed to 24, 48, or 72 hr of hypoxia (n ≥ 3). (C) Dot blot quantification of 5-hmC in SK-N-BE(2) cells exposed to 48 hr of hypoxia. (D) Quantification of 5-mC by HPLC-MS/MS in SK-N-BE(2) cells. Percentage 5-mC is calculated relative to the sum of all cytosine species (n ≥ 3). Data represent means ± SEM. p values calculated by Student’s t test, *p < 0.05, **p < 0.01. See also Figure S1.
Figure 2
Figure 2. 5-hmC Gains Occur at Hypoxia Regulated Regions in SK-N-BE(2) Cells
(A and B) Absolute 5-hmC gains (A) and enrichment for 5-hmC gains (B) were calculated at genomic elements. Regions flanking HIF binding sites are regions ±1 kb from the ChIP-seq peak. Footprints include the ChIP-seq peak and flanking region (Schödel et al., 2011). Data represent means ± SD for two biological replicates. (C) PANTHER pathway analysis of genes with regions gaining at least 3-fold 5-hmC. p values are Bonferroni corrected results of binomial tests (Mi et al., 2013). (D) Regions gaining the most 5-hmC map to the HIF-1 target genes CA9, PGK1, GPI, VEGFA, BNIP3, and ENO1. Plotted points represent combined data from two experiments. (E–H) RNA-seq and hMe-Seal sequencing data are plotted in the Integrated Genomics Viewer (IGV) genome browser at VEGFA, CA9, PGK1, and BNIP3 genes. RefSeq gene tracks represent the position of known genes in the hg19 build of the human genome. Arrows represent the direction of transcription. (I and J) TAB-seq data for the corresponding shaded regions of PGK1 (G) and BNIP3 (H). For each CpG, black, green, and gold represent the percentage of 5-mC, 5-hmC, and unmodified cytosine, respectively. Results represent pooled data over three independent experiments. p values calculated by chi-square tests. See also Figure S2 and Table S2.
Figure 3
Figure 3. TET1 Is Required for Full Hypoxic Gene Induction
(A) TET1 mRNA quantified by qPCR from SK-N-BE(2) cells (n ≥ 4). (B) TET2 and TET3 mRNA quantified by qPCR from SK-N-BE(2) cells exposed to 48 hr of hypoxia (n = 3). (C) TET mRNA levels measured in fragments per kilobase of transcript per million mapped reads (FPKM) by RNA-seq. Data represent Cuffdiff output from two biological replicates of SK-N-BE(2) cells exposed to 48 hr of hypoxia. p values were false discovery rate corrected. (D) TET1 mRNA measured by qPCR in neuroblastoma cell lines exposed to 48 hr of hypoxia (n ≥ 4). (E) TET1 mRNA determined by qPCR, and HIF-1α expression determined by immunoblot, in SK-N-BE(2) cells transfected with siCtrl or siTET1 (n = 3). (F) 5-hmC quantified by dot blot in SK-N-BE(2) cells transfected with siCtrl or siTET1 and exposed to 48 hr of hypoxia. Quantification represents means ± SEM (n = 3). (G and H) qPCR quantification of hypoxia-induced gene expression in TET1 depleted SK-N-BE(2) cells after 48 hr of hypoxia (n = 3). (I) EMSA binding studies of HIF-1 to the CA9 HRE. c, cytosine; h, 5-hmC; m, 5-mC. (J) TAB-seq of the CA9 TSS. The boxed CpG 6 bp upstream of the TSS resides within the HRE. Results are pooled over three replicates. p values calculated by chi-square tests. All graphs represent means ± SEM. p values for expression analysis calculated by Student’s t test, *p < 0.05, **p < 0.01. See also Figure S3.
Figure 4
Figure 4. HIF-1 Regulates TET1 and Is Necessary for Genome-wide and Locus-Specific 5-hmC Gains in SK-N-BE(2) Cells
(A) qPCR quantification of HIF-1 target gene expression in shHIF-1α or shCtrl-transduced cells after 48 hr of hypoxia (n = 3). (B and C) TET1 mRNA quantification by qPCR (B) and 5-hmC quantification by HPLC-MS/MS (C) in shCtrl or shHIF-1α-transduced SK-N-BE(2) cells exposed to 48 hr of hypoxia (n = 3). (D) Regions gaining 5-hmC from Figure 2C are plotted in shCtrl or shHIF-1α-expressing cells. Gains of 5-hmC in hypoxia are represented as an upward shift on the y axis. (E) PANTHER pathway analysis of regions losing 5-hmC in hypoxic shHIF-1α cells relative to hypoxic shCtrl cells. p values are Bonferroni corrected results of binomial tests (Mi et al., 2013). (F and G) hMe-Seal data for parental and transduced SK-N-BE(2) cells exposed to 48 hr of hypoxia or normoxia. (H) Hypoxia stimulates HIF-1-dependent upregulation of TET1, which is necessary for genome-wide 5-hmC increases. Site-specific 5-hmC gains are clustered at hypoxia response genes that require TET1 for induction. All graphs represent means ± SEM. See also Figure S4.

References

    1. Bernstein BE, Birney E, Dunham I, Green ED, Gunter C, Snyder M ENCODE Project Consortium. An integrated encyclopedia of DNA elements in the human genome. Nature. 2012;489:57–74. - PMC - PubMed
    1. Beyer S, Kristensen MM, Jensen KS, Johansen JV, Staller P. The histone demethylases JMJD1A and JMJD2B are transcriptional targets of hypoxia-inducible factor HIF. J Biol Chem. 2008;283:36542–36552. - PMC - PubMed
    1. Bhaskara VK, Mohanam I, Rao JS, Mohanam S. Intermittent hypoxia regulates stem-like characteristics and differentiation of neuroblastoma cells. PLoS ONE. 2012;7:e30905. - PMC - PubMed
    1. Branco MR, Ficz G, Reik W. Uncovering the role of 5-hydroxymethylcytosine in the epigenome. Nat Rev Genet. 2012;13:7–13. - PubMed
    1. Choudhry H, Schödel J, Oikonomopoulos S, Camps C, Grampp S, Harris AL, Ratcliffe PJ, Ragoussis J, Mole DR. Extensive regulation of the non-coding transcriptome by hypoxia: role of HIF in releasing paused RNApol2. EMBO Rep. 2014;15:70–76. - PMC - PubMed

Publication types

Associated data