. 2014 Jun;20(6):624-32.
doi: 10.1038/nm.3543. Epub 2014 May 18.

Cardiac BIN1 folds T-tubule membrane, controlling ion flux and limiting arrhythmia

Affiliations

Cardiac BIN1 folds T-tubule membrane, controlling ion flux and limiting arrhythmia

TingTing Hong et al. Nat Med. 2014 Jun.

Abstract

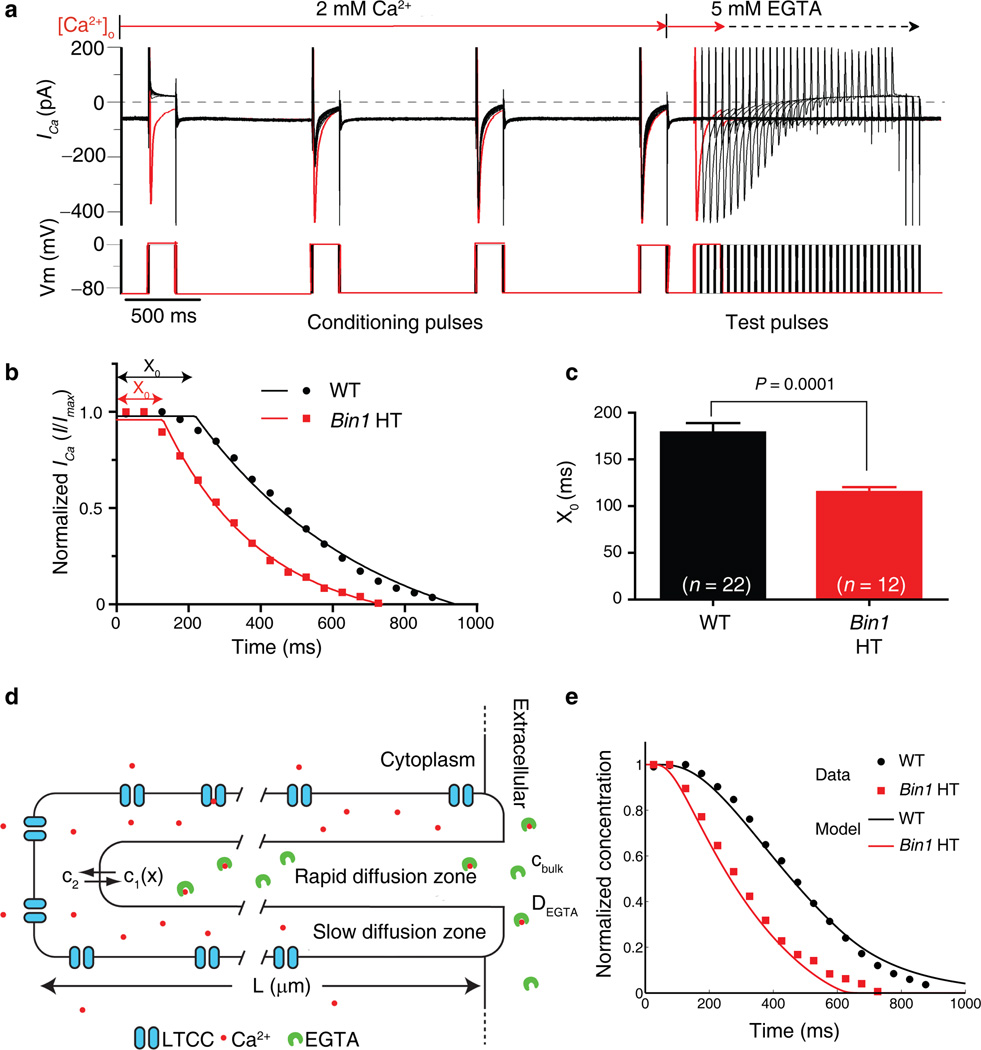
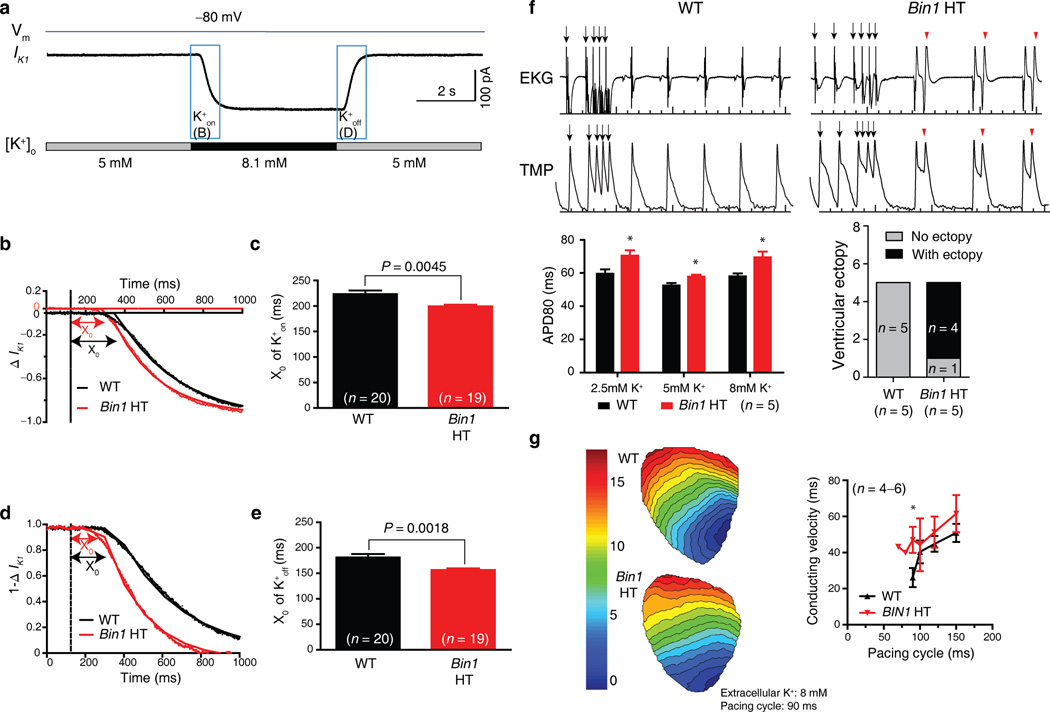
Cardiomyocyte T tubules are important for regulating ion flux. Bridging integrator 1 (BIN1) is a T-tubule protein associated with calcium channel trafficking that is downregulated in failing hearts. Here we find that cardiac T tubules normally contain dense protective inner membrane folds that are formed by a cardiac isoform of BIN1. In mice with cardiac Bin1 deletion, T-tubule folding is decreased, which does not change overall cardiomyocyte morphology but leads to free diffusion of local extracellular calcium and potassium ions, prolonging action-potential duration and increasing susceptibility to ventricular arrhythmias. We also found that T-tubule inner folds are rescued by expression of the BIN1 isoform BIN1+13+17, which promotes N-WASP-dependent actin polymerization to stabilize the T-tubule membrane at cardiac Z discs. BIN1+13+17 recruits actin to fold the T-tubule membrane, creating a 'fuzzy space' that protectively restricts ion flux. When the amount of the BIN1+13+17 isoform is decreased, as occurs in acquired cardiomyopathy, T-tubule morphology is altered, and arrhythmia can result.


Figures

Figure 1
Figure 1
Cardiomyocyte T-tubules are densely folded by BIN1. (α–b) Representative confocal images (a, scale bars: 5 µm) and the fluorescent profiles (b) of live WT and Bin1 HT cardiomyocytes labeled with Di-8-ANNEPS. (c) Quantification of T-tubules peak intensity. (n = 40 from 4–5 cells, P < 0.0001). (d) Cell size normalized membrane capacitance in WT (n = 14) and Bin1 HT (n = 12) cardiomyocytes (P = 0.0181). WC indicates reported whole cell capacitance without T-tubules. (e) 2D transmission electron microscope (TEM) images (Left to right: gross morphology, transverse cross section, and axial cross section) and 3D electron tomography images (right) of WT and Bin1 HT heart sections. Scale bars (left to right): 1 µm, 250 nm, 100 nm, and 100 nm. (f) Electron density profiles (middle) across individual T-tubules marked by the lines in the images above, with average T-tubule electron density in the bottom (n = 75, P < 0.0001). (g) T-tubule lumen area of axial cross sections (n = 80, P < 0.0001). (h) Cardiomyocyte T-tubule contour score (1, circular shape and no folds and spatial complexity; 2, non-circular shape and no folds and spatial complexity; or 3, multiple folds with spatial complexity) distribution (n = 196, P < 0.0001). Data are presented as mean ± SEM, cardiomyocytes are from three mice per genotype, and six left ventricular sections from three hearts per genotype were used for TEM analysis. Student’s t-test and one way-ANOVA were used for statistical analysis.
Figure 2
Figure 2
Bin1 deletion increases extracellular Ca2+ diffusion. (a) Representative patch clamp recording of the LTCC mediated ICa from a WT cardiomyocyte in response to quick change from 2 mM extracellular calcium solution to calcium free 5 mM EGTA solution. (b) Kinetics of ICa current changes using the protocol described in (a) were fitted with one plateau followed by one phase exponential decay. X0 is the initial delay before ICa decays. (c) Comparison of X0 for WT and Bin1 HT. Data are presented as mean ± SEM, P = 0.0001 by student’s t-test (cardiomyocytes are from 3 mice for each genotype). (d) A diagram describing the salient features of a mathematical model for calcium diffusion. (e) Kinetics of ICa current decay computed using the model in (d). The normalized calcium concentration in the slow diffusion zone serves as a surrogate for the calcium current since it is directly related to the inward Ca2+ driving force. The model of WT T-tubules containing a slow diffusion zone matches the experimental data (black curve – model, black circles – data). Removal of the diffusion barrier at the left side of the T-tubule in (a) results in a shorter initial delay as observed in the Bin1 HT experiments (red curve – model, red squares – data).
Figure 3
Figure 3
Bin1 deletion increases extracellular K+ diffusion, prolonging action potential duration and increasing ventricular ectopy. (a) Representative patch clamp recording of IK1 current changes when quickly switching extracellular potassium concentration in a wildtype (WT) cardiomyocyte. (b) Kinetics of IK1 during K+on in WT and Bin1 HT cardiomyocytes (dotted line, dead volume time of 124 ms). (c) Comparison of the initial delay X0 of K+on for WT (n = 20) and Bin1 HT (n = 19) cardiomyocytes (P = 0.0045). (d) Kinetics of IK1 during K+off (1−∆IK1) in WT and Bin1 HT cardiomyocytes. (e) Comparison of X0 of K+off for WT (n = 20) and Bin1 HT (n = 19) cardiomyocytes (P = 0.0018). (f) Top: representative tracings of EKG (top) and TMP (transmembrane potential, bottom) from isolated and langendorff perfused WT (left) and Bin1 HT (right) hearts. Bottom: Action potential duration (APD80) is always prolonged in Bin1 HT hearts whether subjected to low (2.5 mM), normal (5 mM), and high (8 mM) potassium solution (left), and ventricular ectopy is increased in Bin1 HT hearts (right, incidence of arrhythmias during physiological buffer perfusion). (g) Ventricular activation map (left) and conduction velocity (right) of WT and Bin1 HT hearts subjected to high potassium (8 mM) perfusion (*, P < 0.05). Data are presented as mean ± SEM and cardiomyocytes are from three mice for each genotype, student’s t-test was used for statistical analysis.
Figure 4
Figure 4
Ventricular arrhythmias induced by pacing and beta adrenergic activation with isoproterenol. (a) Representative recordings of EKG following a S1–S4 stimulation protocol. Normal sinus node beats resume immediately following pacing in WT mice (top panel), sustained monomorphic ventricular tachycardia (4.5 s) was induced in Bin1 HT mice (middle panel), sustained polymorphic ventricular tachycardia (VT) alternating with ventricular fibrillation (VF) (>20s) was induced in Bin1 HO mice (bottom panel). (b) Heart rate increase (∆HR) in response to isoproterenol was analyzed and compared among the three groups (mean ± SEM, n = 3–4, P = 0.04 by one-way ANOVA). (c) Incidence of sustained VT (>9 QRS) or VF in each group (n = 3–4, P = 0.03 by chi-square). (d) The frequency of ventricular arrhythmias before and after isoproterenol treatment was quantified in each group (n = 3–4, P < 0.01 by two-way ANOVA).
Figure 5
Figure 5
Adult mouse cardiomyocytes express four Bin1 splice variants. (a) Cartoon of Bin1 exons and the splice variants we found in adult mouse cardiomyocytes. BAR, Bin–Amphiphysin–Rvs domain; PI, phosphoinositide binding domain; CLAP, clathrin / AP2 binding region; MDB, myc-binding domain; SH3, SRC Homology 3 domain. (b) Four Bin1 splice variants with alternative inclusion of exon 13 and 17 are detected in adult mouse cardiomyocytes (A.M.C.) using PCR detection with primer sets flanking exon 10–18 or exon 13–18. (c) The percent of each Bin1 variants in adult mouse cardiomyocytes after subcloning and sequencing using PCR primer sets flanking exon 10–18. (d) Quantitative rtPCR analysis of each Bin1 variants (Bin1/HPRT1) in purified neonatal cardiomyocytes (P3, n = 2 litters with 8–10 pups each) and isolated adult mouse cardiomyocytes (n = 5 mice). (e) Western blot analysis confirms the antibody specificity of anti-exon 17 (clone 99D, Sigma) and anti-exon 13 (A#5299, Anaspec) BIN1 antibodies. All four BIN1 isoforms are detected by panBIN1 antibody (rabbit anti BIN1 SH3 domain). (f) Immunofluorescence of anti-exon 17 and anti-exon 13 labeling (red arrow, Z-line/TT region by α-actinin or Cav1.2 co-labeling) in adult mouse cardiomyocytes. (g) Representative confocal images (left, scale bars: 5 µm) and fluorescent profiles (right) of Di-8-ANNEPS membrane labeling in WT and Bin1 HT cardiomyocytes over-expressing GFP, BIN1, BIN1+13, BIN1+17, or BIN1+13+17 (n = 5 cells). Data are presented as mean +/− SEM. *, P < 0.05; **, P < 0.01, and ***, P < 0.001 by student’s t-test or two-way ANOVA.
Figure 6
Figure 6
BIN1+13+17 uses F-actin to connect to Z-disc α-actinin. (a–b) HeLa cells expressing GFP tagged BIN1, BIN1+13, BIN1+17, and BIN1+13+17 (scale bars: 10 µm) (a), with the length of folds like structure (linear streaks) quantified in (b). (Mean ± SEM; n = 20 folds from 5 cells; *** indicates P < 0.001 by one-way ANOVA). (c) TEM confirms that BIN1+13+17 but not BIN1+17 induces elongated membrane folds in HeLa cells. Scale bars: 1 µm (left) and 0.5 µm (right two panels). (d) HeLa cells expressing isoforms of GFP-BIN1 (green) and LifeAct-mCherry (red) (scale bars: 10 µm). (e) GST pulldown of GST-BIN1 isoforms and N-WASP-V5 in HeLa cells. (f) In vitro pyrene-actin polymerization assay using purified Arp2/3, N-WASP and BIN1 isoforms. Left, representative tracing of actin polymerization kinetics. Right, the Vmax data of polymerization kinetics. Data are presented as mean ± SEM (n = 5, * indicates P < 0.05 by one-way ANOVA). The negative control contains pyrene-actin alone with a GST control protein (GST-GFP, bottom black line indicated by the bottom arrow), the positive control contains pyrene-actin supplemented with Arp2/3 and VCA (active domain of N-WASP, top black line indicate by the top arrow), and the rest samples contain pyrene-actin supplemented with Arp2/3, N-WASP with GST-GFP or 1 µM GST-BIN1 isoforms. (g) Purified GST-BIN1 fusion protein pre-coated glutathione beads were added to adult heart lysates for pulldowns of α-actinin (right) or F-actin (left). (h) Schematic illustration of BIN1+13+17 forming an extracellular ionic diffusion barrier inside T-tubules.

References

    1. Soeller C, Cannell MB. Examination of the transverse tubular system in living cardiac rat myocytes by 2-photon microscopy and digital image-processing techniques. Circ Res. 1999;84:266–275. - PubMed
    1. Brette F, Orchard C. T-tubule function in mammalian cardiac myocytes. Circ Res. 2003;92:1182–1192. - PubMed
    1. Cheng H, Lederer WJ, Cannell MB. Calcium sparks: elementary events underlying excitation-contraction coupling in heart muscle. Science. 1993;262:740–744. - PubMed
    1. Bers DM. Cardiac excitation-contraction coupling. Nature. 2002;415:198–205. - PubMed
    1. Pasek M, Simurda J, Christe G. The functional role of cardiac T-tubules explored in a model of rat ventricular myocytes. Philos Transact A Math Phys Eng Sci. 2006;364:1187–1206. - PubMed

Publication types

MeSH terms