. 2014 Sep;12(9):1303-13.
doi: 10.1158/1541-7786.MCR-13-0673. Epub 2014 May 16.

Dynamic interactions between cancer cells and the embryonic microenvironment regulate cell invasion and reveal EphB6 as a metastasis suppressor

Affiliations

Dynamic interactions between cancer cells and the embryonic microenvironment regulate cell invasion and reveal EphB6 as a metastasis suppressor

Caleb M Bailey et al. Mol Cancer Res. 2014 Sep.

Abstract

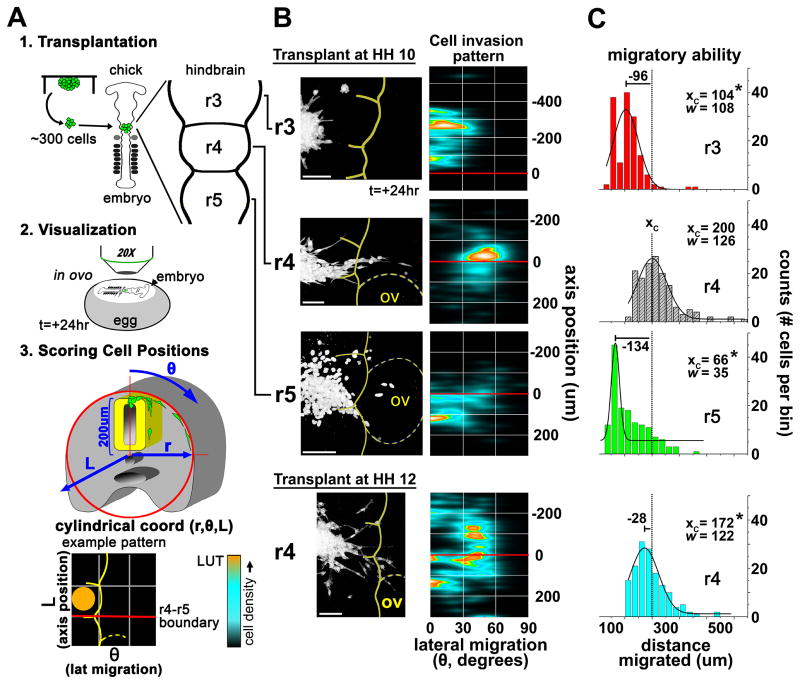
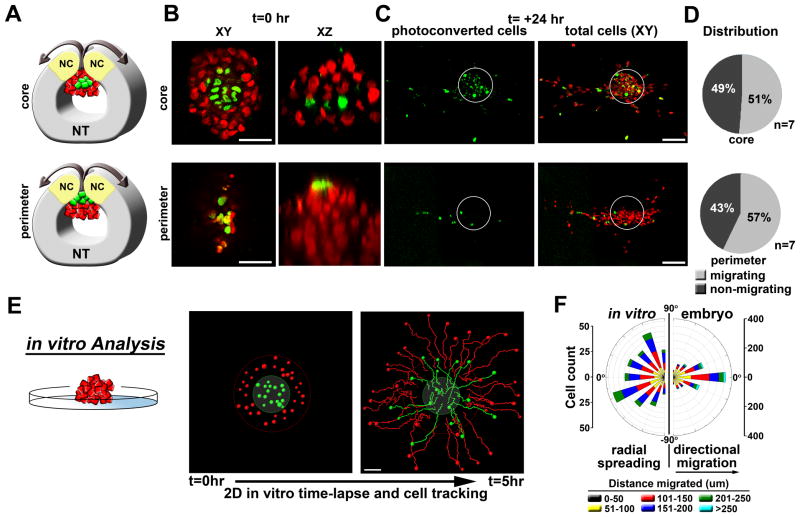
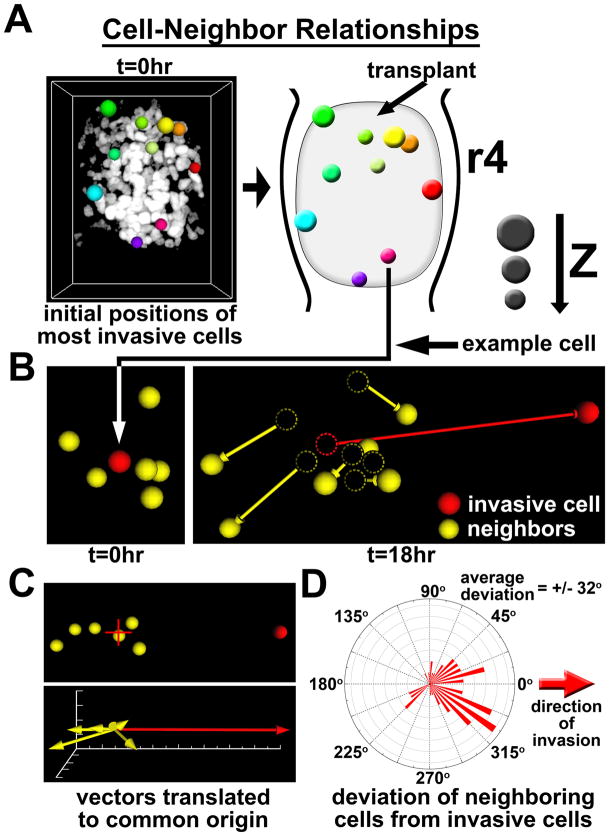
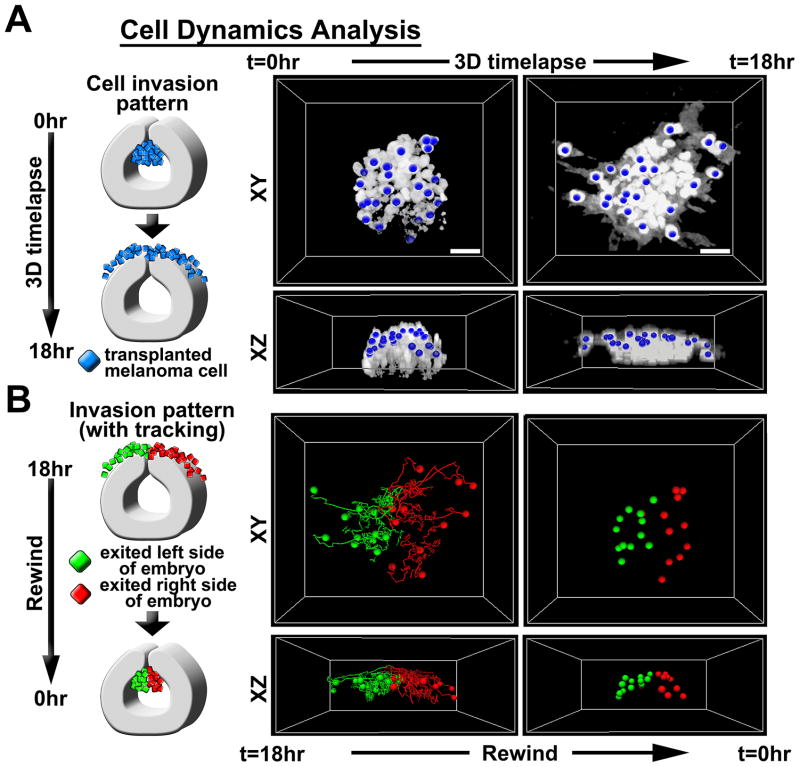
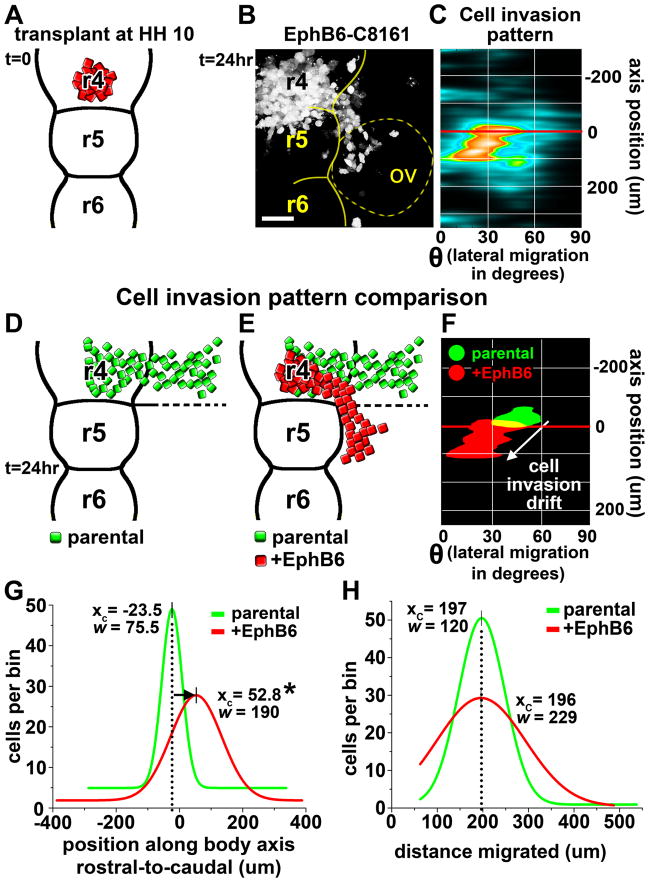
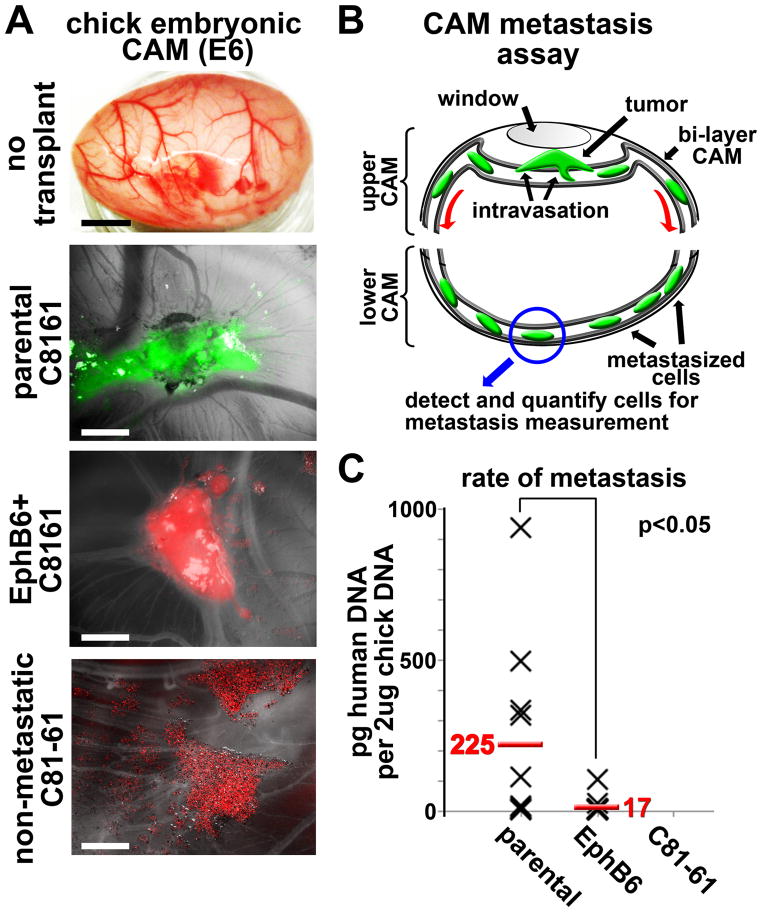
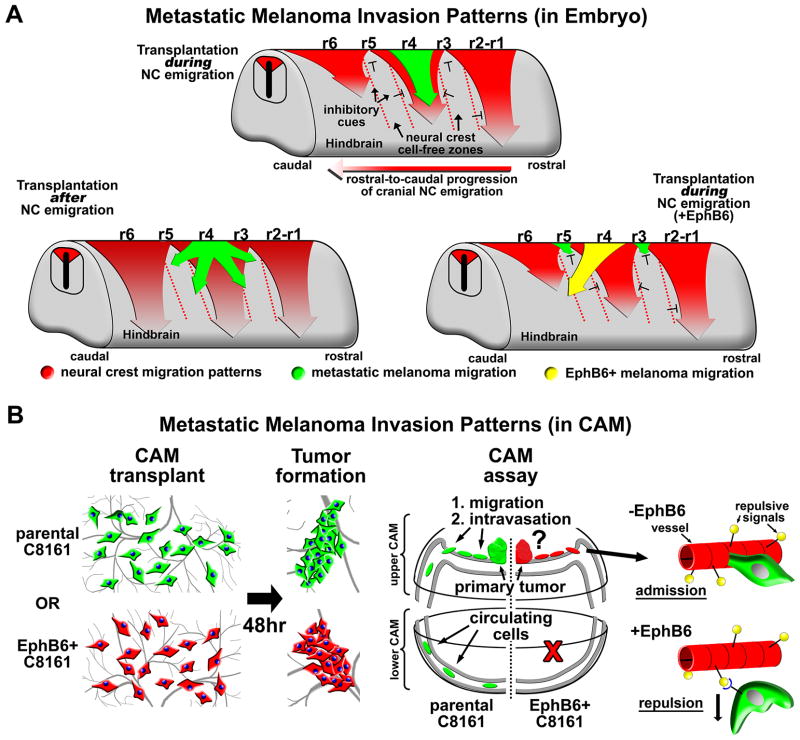
Metastatic dissemination drives the high mortality associated with melanoma. However, difficulties in visualizing in vivo cell dynamics during metastatic invasion have limited our understanding of these cell behaviors. Recent evidence has revealed that melanoma cells exploit portions of their ancestral embryonic neural crest emigration program to facilitate invasion. What remains to be determined is how embryonic microenvironmental signals influence invasive melanoma cell behavior, and whether these signals are relevant to human disease. To address these questions, we interrogated the role of the neural crest microenvironment in dictating the spatiotemporal pattern of melanoma cell invasion in the chick embryo using 2-photon time-lapse microscopy. Results reveal that both permissive and inhibitory neural crest microenvironmental signals regulate the timing and direction of melanoma invasion to coincide with the neural crest migration pattern. These cues include bidirectional signaling mediated through the ephrin family of receptor tyrosine kinases. We demonstrate that EphB6 reexpression forces metastatic melanoma cells to deviate from the canonical migration pattern observed in the chick embryo transplant model. Furthermore, EphB6-expressing melanoma cells display significantly reduced metastatic potential in a chorioallantoic membrane (CAM) metastasis assay. These data on melanoma invasion in the embryonic neural crest and CAM microenvironments identify EphB6 as a metastasis suppressor in melanoma, likely acting at the stage of intravasation.

Implications: This article links cellular metastasis to behaviors observed in the ancestrally related embryonic neural crest and demonstrates the powerful influence of the embryonic microenvironment in regulating cell migratory behavior.


Conflict of interest statement

Conflict of Interest: The authors report no conflict of interest

Figures

Figure 1
Figure 1. Cytometric quantification of migratory behaviors of melanoma cells transplanted into varying regions and developmental stages of the chick embryonic hindbrain
A) A cartoon depicting the experimental methods. Tumor cells are transplanted into various regions of the embryonic chick hindbrain and allowed to migrate for 24 hours. Cells are then imaged in high resolution and cell positions are quantified using a cylindrical coordinate system where length (L) represents the cell position along the rostral-caudal axis and theta (θ) represents the angle deviant from the vertical (dorsal-ventral) axis of the embryo and is a direct representation of lateral migratory distance. B) Cytometric quantification of transplanted cells in different regions of the hindbrain (r3, r4, r5) during active neural crest migration (HH10) and following the cessation of neural crest migration (HH12). The representative micrograph shows typical melanoma cell migration relative to the location and timing of the transplant. Meter bar=100um. The 30 most invasive cells from 9 transplants were used to populate the densitometric scatterplot that defines the Cell Invasion Pattern. The scatterplot uses embryonic landmarks as fiducal points representing the embryonic midline (y-axis) and the boundary between r4 and r5 (red line at axis position 0). C) A comparison of migratory ability (total cell displacement) is shown by the histogram and accompanying Gaussian fit. Xc is the center of the peak and represents the average X-value. W equals 2 times the standard deviation of the Gaussian distribution, or approximately 0.849 the width of the peak at half height. The dashed line in the histograms represents the Xc value of the HH10/r4 transplant. n=270 cells for each histogram. * p<0.05.
Figure 2
Figure 2. Migratory ability is cell-autonomous
A) A cartoon depicting the 2-photon in ovo photoconversion of H2B:PSCFP2-labeled C8161 melanoma cells. Following transplantation into the chick embryo (r4,HH10), sub-populations of tumor cells in either the core or the perimeter of the graft were photoconverted with a 2-photon microscope using a wavelength of 780nm. B) Representative micrographs showing the photoconversion of tumor cells at t=0hr in either the core or the perimeter of the graft. XY and XZ views are provided. C) Representative micrographs showing the locations of migratory photoconverted tumor cells at t=24hr. The white circles outline the initial transplant graft location and show the non-migrating cells remaining in the neural tube. D) Pie charts depicting the percentage of photoconverted migratory verses non-migratory cells. Cells were scored as migrating or non-migrating based on their location within or without this circle. E) In vitro time-lapse analysis of a C8161 melanoma cell cluster placed on a basement membrane matrix. Cells were labeled based on position (red=periphery, green=core). Migratory tracks are shown at 5hr. F) A rose plot comparing cell directionality in vitro with directionality observed in the embryo. In the embryo, 90 degrees represents the anterior-posterior embryo axis. Cell positions were calculated for all migrating cells from 9 different transplants (r4,HH10, >1000 cells). Angles between cell trajectory and the horizontal r4 migratory stream were then determined. The size of each bar depicts the number of binned cells for a given angle. The colored segments depict the distance migrated by cells within the bin.
Figure 3
Figure 3. Invasive melanoma do not display follow-the-leader migratory behaviors
A) Colored spheres represent the initial positions of the 10 most invasive cells (based on total displacement). z-depth can be gauged by the diameter of the sphere. Both the raw data image and a reference cartoon are provided. B) The migratory direction (displacement) of a representative highly invasive cell (red) was compared to the directions of its 6 closest neighboring cells (yellow). Initial positions are viewed at t=0hr. Final positions, including displacement vectors, are shown at t=18hr. The dashed circles represent the initial locations of each cell. C) Displacement vectors for all of the cells shown in section “D” were translated to a common origin and compared for changes in direction. The red + marks the origin. D) The deviation angles between the displacement vectors of the 10 most invasive cells and each of their six closest neighbors was calculated and graphed on a roseplot histogram. The red arrow indicates the direction of the highly invasive cells. The average deviation was +/− 32 degrees.
Figure 4
Figure 4. Invasive melanoma cells are guided by the embryonic neural crest microenvironment
A) 2-photon time-lapse cell tracking was used to determine the initial locations of migratory tumor cells. 3D time-lapse images were acquired in ovo using 2-photon microscopy. Images were analyzed using Imaris software to track cells over time. B) Cells were labeled at t=18hr based on whether they had migrated to the left or right of the embryonic dorsal midline. Cells on the left were labeled green and cells on the right were labeled red. Cell positions were then tracked backwards to identify the initial position at t=0hr. Both XY and XZ views are provided
Figure 5
Figure 5. Re-expression of EphB6 in C8161 melanoma cells results in aberrant directional migration without affecting migratory ability
A) A cartoon depicting the transplant of EphB6+ C8161 melanoma cells into r4 at HH10. B) A representative micrograph showing migratory behaviors of transplanted EphB6+ C8161 cells. The neural tube boundary is outlined in yellow and the position of the otic vesicle (ov) is shown by the dotted yell line. Individual rhombomeres are also labeled. C) A densitometric scatterplot of the cell invasion pattern of the positions of the 30 most invasive cells from 10 transplant experiments. The y-axis represents the embryo midline. The x-axis represents lateral migration and is given in degrees (cylindrical coordinates). The r4/r5 boundary is depicted by the red line. D–E) Cartoons depicting the invasion patterns of parental C8161 cells (from Figure 1) and EphB6+ C8161 cells. F) An overlay of the cell invasion pattern from parental C8161 cells (green) and EphB6+ C8161 cells (red), highlighting the caudal shift in cell positions at t=24hr. G) The Gaussian fit to a histogram comparing cell positions of parental C8161 cells and EphB6+ C8161 cells along the rostral-caudal axis at t=24hr. H) The Gaussian fit to a histogram comparing total distance migrated (total displacement) between parental C8161 cells and EphB6+ C8161 cells. Xc is the center of the peak and represents the average X-value. W equals 2 times the standard deviation of the Gaussian distribution, or approximately 0.849 the width of the peak at half height. * p<0.05.
Figure 6
Figure 6. Re-expression of EphB6 in C8161 melanoma cells causes a significant loss of metastatic potential but does not affect tumorigenicity in a chorioallantoic membrane (CAM) metastasis assay
A) Images of a native chick embryo CAM and representative tumors from parental C8161 cells (green) and EphB6+ C8161 cells (red) grown on the CAM. 1e6 cells in suspension (10ul volume) were dropped onto the CAM at day E10. Tumor formation occurred over 48 hours. Non-metastatic C81–61 cells did not form tumors. The black meter bar represents 1cm and the white meter bars represent 2.5mm. B) A cartoon depicting the CAM metastasis assay. Tumor cells are placed onto the upper CAM through a window in the egg shell. The egg is resealed for 48 hours. The lower CAM is removed and genomic DNA is harvested from the tissue. Metastatic human cells are detected by qPCR using primers that amplify a human-specific Alu element. C) A scatterplot showing detected amounts of human DNA per 2ug chick CAM DNA. Each X represents one biological replicate. A t-test was used to calculate statistical significance.
Figure 7
Figure 7. A model comparison of metastatic melanoma invasion patterns in the embryonic hindbrain and on the vascularized embryonic chorioallantoic membrane (CAM)
A) Three different cartoons comparing metastatic melanoma invasion patterns from different rhombomeres in the hindbrain both during and after neural crest migration. The embryonic hindbrain directs the formation of discrete neural crest migratory pathways emerging from specific hindbrain segments called rhombomeres, listed as r1 through r6. Neural crest migration proceeds in a rostral-to-caudal progression. Neural crest invasion patterns are depicted by red arrows. Hashed red lines highlight neural crest cell-free zones that are thought to be established by the presence of inhibitory cues within the microenvironment. When metastatic melanoma cells are transplanted into the dorsal neural tube during active neural crest migration, melanoma cells invade along neural crest migratory pathways. Melanoma invasion patterns are regulated spatially and temporally by the developing embryo. This pattern is disrupted in melanoma cells expressing EphB6. Melanoma invasion patterns are shown for both parental C8161 cells (green) and EphB6+ C8161 cells (yellow). B) C8161 melanoma cells in suspension are dropped onto the CAM of an E10 chick embryo. Cells aggregate over 48 hours to form a tumor. At this time, cells that are capable of intravasation can be detected in the lower CAM tissue. The re-expression of EphB6 on C8161 cells abrogates metastasis, possibly by inhibiting C8161 cells from entering the CAM vasculature.

References

    1. Spano D, Heck C, De Antonellis P, Christofori G, Zollo M. Molecular networks that regulate cancer metastasis. Semin Cancer Biol. 2012;22:234–49. - PubMed
    1. Condeelis J, Weissleder R. In vivo imaging in cancer. Cold Spring Harb Perspect Biol. 2010;2:a003848. - PMC - PubMed
    1. Polacheck WJ, Zervantonakis IK, Kamm RD. Tumor cell migration in complex microenvironments. Cell Mol Life Sci. 2013;70:1335–56. - PMC - PubMed
    1. Le Douarin NM, Kalcheim C. The Neural Crest. 2. Cambridge: Cambridge University Press; 1999.
    1. Trainor PA, Krumlauf R. Patterning the cranial neural crest: hindbrain segmentation and Hox gene plasticity. Nat Rev Neurosci. 2000;1:116–24. - PubMed

Publication types

Substances