

doi: 10.1038/nmeth.2964.
Epub 2014 May 18.
Simultaneous whole-animal 3D imaging of neuronal activity using light-field microscopy
Affiliations
- PMID: 24836920
- PMCID: PMC4100252
- DOI: 10.1038/nmeth.2964
Item in Clipboard
Simultaneous whole-animal 3D imaging of neuronal activity using light-field microscopy
Nat Methods.
2014 Jul.
Abstract
High-speed, large-scale three-dimensional (3D) imaging of neuronal activity poses a major challenge in neuroscience. Here we demonstrate simultaneous functional imaging of neuronal activity at single-neuron resolution in an entire Caenorhabditis elegans and in larval zebrafish brain. Our technique captures the dynamics of spiking neurons in volumes of ∼700 μm × 700 μm × 200 μm at 20 Hz. Its simplicity makes it an attractive tool for high-speed volumetric calcium imaging.
Figures
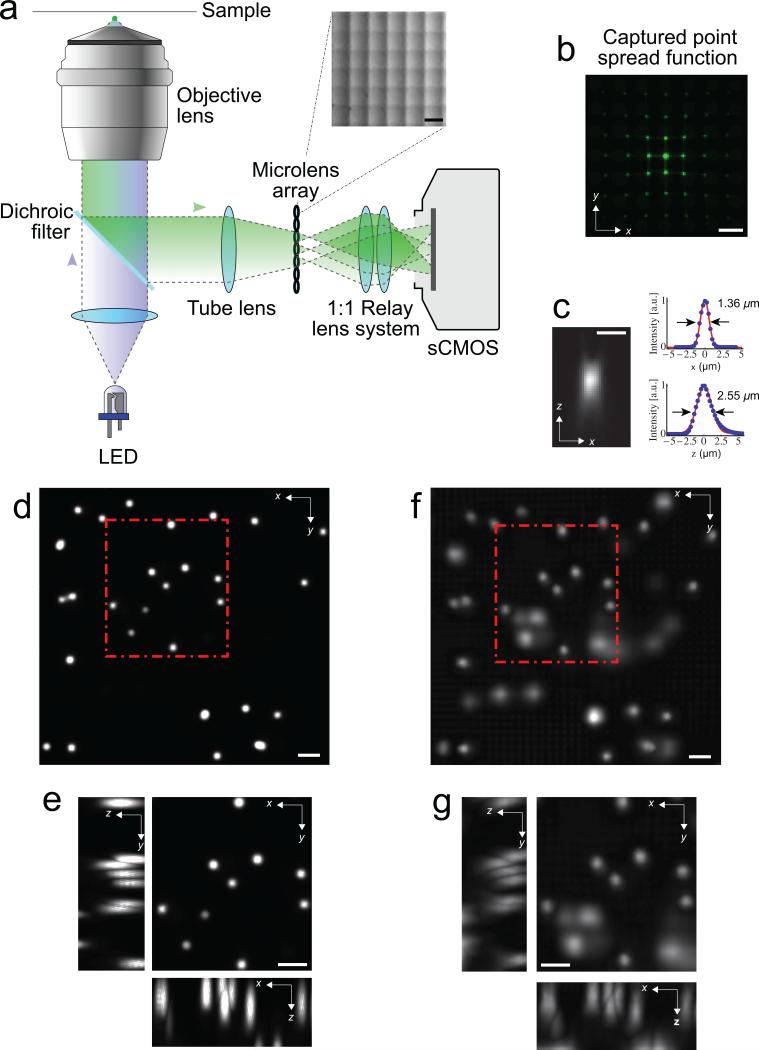
Light-field deconvolution microscopy (LFDM). (a) A microlens arraywas appended to the camera port of a standard wide-field microscope. The lensarray (pitch 150 μm, focal length 3mm, OKO Tech) was placed in the primaryimage plane of the fluorescence microscope. The array itself was imaged with a1:1 relay lens system onto the chip of a sCMOS camera. See Methods for details.The inset shows a close-up picture of the microlens array. (b) The point spreadfunction (PSF) of a sub-diffraction sized bead located at z = 7.5 μm off the focalplane, as seen through the microlens array. Scale bar 150 μm in (a, b). (c) Axial(xz) PSF at z = 7.5 μm, reconstructed using LFDM, and corresponding x- as wellas z-profiles, showing lateral and axial resolution, respectively. Scale bar 3 μm.(d) Maximum-intensity projection of a deconvolved wide-field focal stack taken without microlenses. The sample consists of 6 μm-sized fluorescent beads inagarose, mimicking the distribution of neurons in C. elegans. (e) Zoom-in of highlighted area, with xz- as well as yz-section maximum-intensity projections.The individual beads are well resolved in this image. (e, f) Correspondingvolume of the same beads, 4 – 28 μm off the focal plane, reconstructed via 15iterations of light-field deconvolution algorithm. Although the fluorescence ofsome lower lying beads is faintly visible, individual beads can still be wellresolved. Scale bar 10 μm in (d-g).

Whole animal Ca2+-imaging of Caenorhabditis elegans using light-fieldmicroscopy. (a) Wide-field image of the worm inside a microfluidicpoly(dimethylsiloxane) (PDMS) device used to immobilize the worm. Head is atbottom right. (b) Maximum intensity projection (MIP) of light-field deconvolvedimage (15 iterations) containing 14 distinct z-planes. The majority of the wormand its nervous system are clearly visible, including the head ganglia (at bottomright) as well as the ventral cord. Scale bar 50 μm. (c) Ca2+-intensity traces(ΔF/F0) of NLS-GCaMP5K fluorescence of selected neurons in the ventral cordand head region, as indicated by colored arrows and numbers in (b), and imagedvolumetrically at 5 Hz for 200 seconds. Also see Supplementary Video 1. (d)Zoom of the brain region, with MIP of xy plane as well as xz and yz cross-sections indicated by the dashed lines. Single neurons are well resolved (Supplementary Video 2). Scale bar 10 μm. (e) Individual z planes of typical recording of theworm's brain, reconstructed from a single camera exposure (see also Supplementary Fig. 2 for neuron IDs). In this recording, the worm's center wasplaced at the focal plane of the objective. Scale bar 50 μm. (f) Activity of all 74neurons identified in (e), also see Supplementary Video 4. Each row shows atime-series heat map. Color indicates percent fluorescence changes (ΔF/F0);scaling is indicated by the color bar on the right. The x-axis in (f) representselapsed recording time while the y axis shows individual neurons.
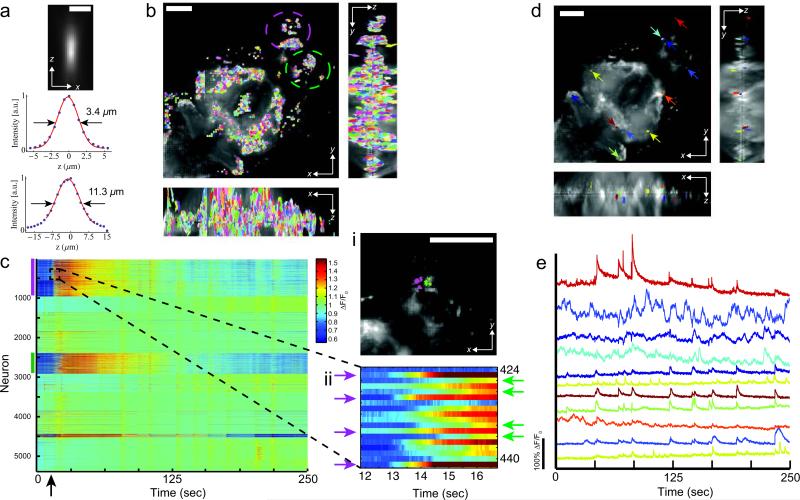
Whole-brain Ca2+-imaging of larval zebrafish brains in vivo.(a) Axial point spread function (PSF) of a 0.5 μm sized bead located at z = 28 μm off the focal plane for the 20× 0.5NA lens and corresponding x and z-profiles.Scale bar 10 μm. (b) Maximum intensity projection (MIP) of light-fielddeconvolved volume (8 iterations) containing 51 distinct z planes, captured at 50ms per frame exposure time and spaced 4 μm apart, showing xy plane, xz and yz cross-sections. Spatial filters, each representing individual cells, identified using PCA/ICA analysis are shown. (c) Extracted Ca2+-intensity signal (ΔF/F0)of GCaMP5 fluorescence using spatial filters shown in (b). Each row shows atime-series heat map with color indicating percent fluorescence changes (ΔF/F0).In total, 5,379 filters were automatically identified most of which correspond toindividual neurons. Color bars denote encircled regions in (b), which includeolfactory epithelium, olfactory bulb and telencephalon. At ~15 sec (denoted bythe arrow), decomposed fish water (an intrinsically aversive odor) was added tothe recording chamber evoking activity in the olfactory system. (c i, ii) Zoom-inof the dashed area in (c) showing individual Ca2+-traces and their dynamicsimmediately following odor stimulation. The high time-resolution reveals subtle differences in the exact timing of the onset of the response for different spatial filters. Groups of cells constituting of neurons all within similar spatial proximitycan be observed (c i). While the neurons in each group exhibit a nearly synchronous onset of their activity, the collective response of each group isdelayed with respect to the others. (d) Overlay of MIP with randomly selectedspatial filters. (e) Ca2+-intensity traces of selected cells shown in (d). Neuronswere manually selected from the olfactory system, midbrain and hindbrain.Trace color matches spatial filter color in (d). Scale bar is 100 μm in (b), (d) and(e). Also see Supplementary Video 6.
References
Publication types
MeSH terms
Substances
Grants and funding
LinkOut - more resources
Full Text Sources
Other Literature Sources
Molecular Biology Databases
