High producer haplotype (CAG) of -863C/A, -308G/A and -238G/A polymorphisms in the promoter region of TNF-α gene associate with enhanced apoptosis of lymphocytes in HIV-1 subtype C infected individuals from North India
- PMID: 24837009
- PMCID: PMC4024031
- DOI: 10.1371/journal.pone.0098020
High producer haplotype (CAG) of -863C/A, -308G/A and -238G/A polymorphisms in the promoter region of TNF-α gene associate with enhanced apoptosis of lymphocytes in HIV-1 subtype C infected individuals from North India
Abstract
Introduction: The natural history of HIV-1 infection and its progression towards AIDS vary considerably among individuals. Host genetic factors may be one of the possible reasons for variable HIV-1 disease progression. Single nucleotide polymorphisms (SNPs) in the promoter region of TNF-α gene can influence its production. The aim of the present study was to determine the association of functional TNF-α SNPs and its associated parameters related to apoptosis that may influence the rate of HIV-1 disease progression.
Methods: Therapy naive, 100 HIV slow progressors (SPs), 100 HIV fast progressors (FPs), 50 HIV exposed but seronegative individuals (ESNs) and 260 healthy controls from same ethnic origin were recruited. Genotyping of TNF-α variants (-863C/A, -308G/A and -238G/A) was done using PCR-RFLP. CD4 counts were determined by flow cytometry. Plasma viral load was estimated by COBAS AMPLICOR HIV-1 monitor test. Plasma TNF-α concentration was estimated by Human CBA Th1/Th2 cytokine kit. The lymphocyte mitochondrial membrane potential was measured by JC-1 dye by flow cytometry.
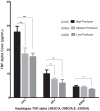
Results: Genotype and allele frequency of TNF-α -238G/A and -863C/A was not significantly different in HIV-1-infected patients when compared to controls, while that of TNF-α -308G/A variant (high TNF-α producer) was significantly higher in FPs compared to SPs (p<0.01, OR = 3.43). Haplotype analyses also showed that carriers of high TNF-α producing haplotype CAG was significantly more common among FPs compared to SPs (p<0.01, OR = 3). The circulating TNF-α levels in blood also correlated well with genotypes. The lymphocyte mitochondrial membrane potential of FPs having CAG haplotype was significantly low as compared to wild type (CGG) haplotype (417±22 vs 571±28, p<0.01).
Conclusion: High producer haplotype, CAG of TNF-α gene associates with enhanced apoptosis of lymphocytes in HIV-1 infected individuals, hence faster progression to AIDS. However, further functional studies are needed to confirm this association and this knowledge may help clinicians to better understand the disease outcome.
Conflict of interest statement
Figures


Similar articles
-
Effect of TNF-alpha genetic variants and CCR5 Delta 32 on the vulnerability to HIV-1 infection and disease progression in Caucasian Spaniards.BMC Med Genet. 2010 Apr 26;11:63. doi: 10.1186/1471-2350-11-63. BMC Med Genet. 2010. PMID: 20420684 Free PMC article.
-
Association of TNF-α gene alterations (c.-238G>A, c.-308G>A, c.-857C>T, c.-863C>A) with primary glaucoma in north Indian cohort.Gene. 2019 Aug 15;709:25-35. doi: 10.1016/j.gene.2019.05.035. Epub 2019 May 25. Gene. 2019. PMID: 31132515
-
Combination of low producer AA-genotypes in IFN-γ and IL-10 genes makes a high risk genetic variant for HIV disease progression.Cytokine. 2016 Jan;77:135-44. doi: 10.1016/j.cyto.2015.11.009. Epub 2015 Nov 12. Cytokine. 2016. PMID: 26579633
-
Association Of -308G/A, -238G/A TNF-α Polymorphisms with Multiple Myeloma Risk and Survival: A Systematic Review and Meta-Analysis.Clin Lymphoma Myeloma Leuk. 2022 Feb;22(2):e96-e115. doi: 10.1016/j.clml.2021.08.010. Epub 2021 Aug 31. Clin Lymphoma Myeloma Leuk. 2022. PMID: 34642126
-
TNF-α gene promoter polymorphisms contribute to periodontitis susceptibility: evidence from 46 studies.J Clin Periodontol. 2014 Aug;41(8):748-59. doi: 10.1111/jcpe.12279. Epub 2014 Jul 2. J Clin Periodontol. 2014. PMID: 24905365 Review.
Cited by
-
Thrombosis and lymphocyte subsets of COVID-19 omicron BA.2 variant patients with cancer.Front Oncol. 2022 Nov 10;12:1048999. doi: 10.3389/fonc.2022.1048999. eCollection 2022. Front Oncol. 2022. PMID: 36439504 Free PMC article.
-
Associations of procalcitonin, C-reaction protein and neutrophil-to-lymphocyte ratio with mortality in hospitalized COVID-19 patients in China.Sci Rep. 2020 Sep 14;10(1):15058. doi: 10.1038/s41598-020-72164-7. Sci Rep. 2020. PMID: 32929124 Free PMC article.
-
Oral Lesions Associated with COVID-19 and the Participation of the Buccal Cavity as a Key Player for Establishment of Immunity against SARS-CoV-2.Int J Environ Res Public Health. 2022 Sep 9;19(18):11383. doi: 10.3390/ijerph191811383. Int J Environ Res Public Health. 2022. PMID: 36141654 Free PMC article. Review.
-
Cell Population Data and Serum Polyclonal Immunoglobulin Free Light Chains in the Assessment of COVID-19 Severity.Viruses. 2021 Jul 15;13(7):1381. doi: 10.3390/v13071381. Viruses. 2021. PMID: 34372587 Free PMC article.
-
Factors associated with disease severity and mortality among patients with COVID-19: A systematic review and meta-analysis.PLoS One. 2020 Nov 18;15(11):e0241541. doi: 10.1371/journal.pone.0241541. eCollection 2020. PLoS One. 2020. PMID: 33206661 Free PMC article.
References
-
- Telenti A, Carrington M (2008) Host factors associated with outcome from primary human immunodeficiency virus-1 infection. Curr Opin HIV AIDS 3: 28–35. - PubMed
-
- Deghaide NH, Rodrigues Mde L, Castelli EC, Mendes-Junior CT, Figueiredo JF, et al. (2009) Tumor necrosis factor region polymorphisms are associated with AIDS and with cytomegalovirus retinitis. AIDS 23: 1641–1647. - PubMed
-
- Heijmans BT, Westendorp RG, Droog S, Kluft C, Knook DL, et al. (2002) Association of the tumour necrosis factor alpha -308G/A polymorphism with the risk of diabetes in an elderly population-based cohort. Genes Immun 3: 225–228. - PubMed
-
- Kim YJ, Lee HS, Yoon JH, Kim CY, Park MH, et al. (2003) Association of TNF-alpha promoter polymorphisms with the clearance of hepatitis B virus infection. Hum Mol Genet 12: 2541–2546. - PubMed
Publication types
MeSH terms
Substances
LinkOut - more resources
Full Text Sources
Other Literature Sources
Medical
Research Materials
Miscellaneous

