

Efficient visual-search model observers for PET
- PMID: 24837105
- PMCID: PMC4075584
- DOI: 10.1259/bjr.20140017
Efficient visual-search model observers for PET
Abstract
Objective: Scanning model observers have been efficiently applied as a research tool to predict human-observer performance in F-18 positron emission tomography (PET). We investigated whether a visual-search (VS) observer could provide more reliable predictions with comparable efficiency.
Methods: Simulated two-dimensional images of a digital phantom featuring tumours in the liver, lungs and background soft tissue were prepared in coronal, sagittal and transverse display formats. A localization receiver operating characteristic (LROC) study quantified tumour detectability as a function of organ and format for two human observers, a channelized non-prewhitening (CNPW) scanning observer and two versions of a basic VS observer. The VS observers compared watershed (WS) and gradient-based search processes that identified focal uptake points for subsequent analysis with the CNPW observer. The model observers treated "background-known-exactly" (BKE) and "background-assumed-homogeneous" assumptions, either searching the entire organ of interest (Task A) or a reduced area that helped limit false positives (Task B). Performance was indicated by area under the LROC curve. Concordance in the localizations between observers was also analysed.
Results: With the BKE assumption, both VS observers demonstrated consistent Pearson correlation with humans (Task A: 0.92 and Task B: 0.93) compared with the scanning observer (Task A: 0.77 and Task B: 0.92). The WS VS observer read 624 study test images in 2.0 min. The scanning observer required 0.7 min.
Conclusion: Computationally efficient VS can enhance the stability of statistical model observers with regard to uncertainties in PET tumour detection tasks.
Advances in knowledge: VS models improve concordance with human observers.
Figures
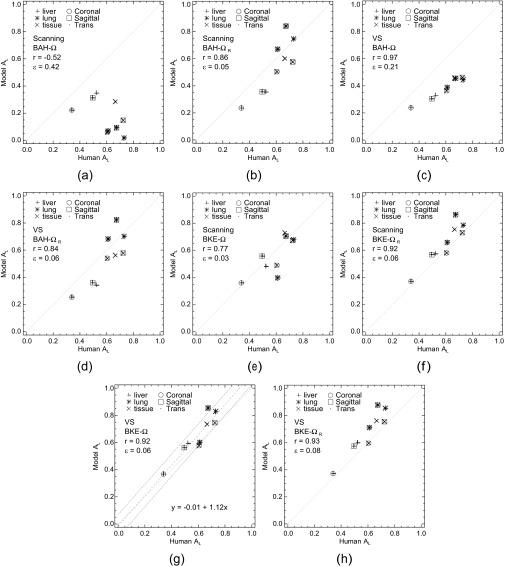
 from the human observers to the areas obtained from a model observer with one of the four tasks. The correlation coefficient (r) and root-mean-squared error (ε) are provided for each comparison. BAH, background-assumed-homogeneous; BKE, background-known-exactly; VS, visual search.
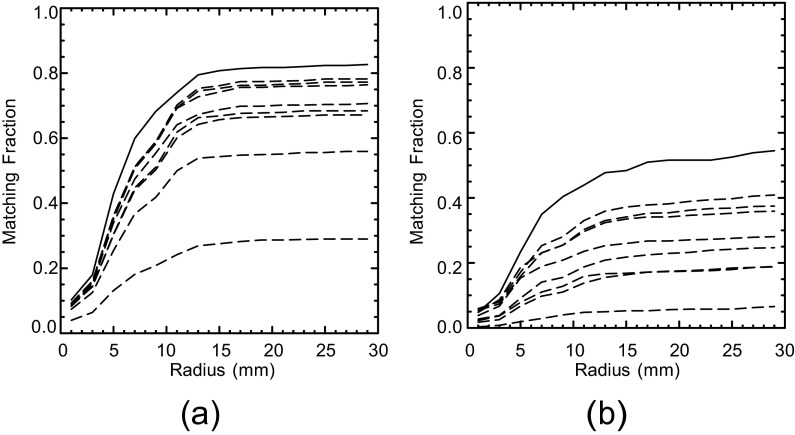
 for the model observers with the background-known-exactly and background-assumed-homogeneous tasks. Based on these plots, the threshold Rm was set to 15 mm.
Similar articles
-
Visual-search observers for assessing tomographic x-ray image quality.Med Phys. 2016 Mar;43(3):1563-75. doi: 10.1118/1.4942485. Med Phys. 2016. PMID: 26936739 Free PMC article.
-
A visual-search model observer for multislice-multiview SPECT images.Med Phys. 2013 Sep;40(9):092505. doi: 10.1118/1.4818824. Med Phys. 2013. PMID: 24007181 Free PMC article.
-
Experimental comparison of lesion detectability for four fully-3D PET reconstruction schemes.IEEE Trans Med Imaging. 2009 Apr;28(4):523-34. doi: 10.1109/TMI.2008.2006520. Epub 2008 Oct 3. IEEE Trans Med Imaging. 2009. PMID: 19272998 Free PMC article.
-
Unified measurement of observer performance in detecting and localizing target objects on images.Med Phys. 1996 Oct;23(10):1709-25. doi: 10.1118/1.597758. Med Phys. 1996. PMID: 8946368 Review.
-
Model observers and detectability index in x-ray imaging: historical review, applications and future trends.Phys Med Biol. 2025 Apr 1;70(7). doi: 10.1088/1361-6560/adc070. Phys Med Biol. 2025. PMID: 40081014 Review.
Cited by
-
Medical image quality metrics for foveated model observers.J Med Imaging (Bellingham). 2021 Jul;8(4):041209. doi: 10.1117/1.JMI.8.4.041209. Epub 2021 Aug 16. J Med Imaging (Bellingham). 2021. PMID: 34423070 Free PMC article.
-
Foveated Model Observers for Visual Search in 3D Medical Images.IEEE Trans Med Imaging. 2021 Mar;40(3):1021-1031. doi: 10.1109/TMI.2020.3044530. Epub 2021 Mar 2. IEEE Trans Med Imaging. 2021. PMID: 33315556 Free PMC article.
-
Approximating the Ideal Observer for Joint Signal Detection and Localization Tasks by use of Supervised Learning Methods.IEEE Trans Med Imaging. 2020 Dec;39(12):3992-4000. doi: 10.1109/TMI.2020.3009022. Epub 2020 Nov 30. IEEE Trans Med Imaging. 2020. PMID: 32746143 Free PMC article.
-
Foveated Model Observers to predict human performance in 3D images.Proc SPIE Int Soc Opt Eng. 2017 Feb 11;10136:101360P. doi: 10.1117/12.2252952. Epub 2017 Mar 10. Proc SPIE Int Soc Opt Eng. 2017. PMID: 29176921 Free PMC article.
-
On the correlation between second order texture features and human observer detection performance in digital images.Sci Rep. 2020 Aug 11;10(1):13510. doi: 10.1038/s41598-020-69816-z. Sci Rep. 2020. PMID: 32782415 Free PMC article.
References
-
- ICRU. Medical imaging—the assessment of image quality Report 54. Bethesda, MD: International Commission on Radiation Units and Measurements; 1996.
-
- Fryback DG, Thornbury JR. The efficacy of diagnostic imaging. Med Decis Making 1991; 11: 88–94. - PubMed
-
- Gazelle GS, Seltzer SE, Judy PF. Assessment and validation of imaging methods and technologies. Acad Radiol 2003; 10: 894–6. - PubMed
-
- Van Trees HL. Detection, estimation, and modulation theory. Vol. I. New York, NY: Wiley; 1968.
Publication types
MeSH terms
Grants and funding
LinkOut - more resources
Full Text Sources
Other Literature Sources
