. 2014 Jun;32(6):554-61.
doi: 10.1038/nbt.2915. Epub 2014 May 18.

Wnt signaling controls the specification of definitive and primitive hematopoiesis from human pluripotent stem cells

Affiliations

Wnt signaling controls the specification of definitive and primitive hematopoiesis from human pluripotent stem cells

Christopher M Sturgeon et al. Nat Biotechnol. 2014 Jun.

Abstract

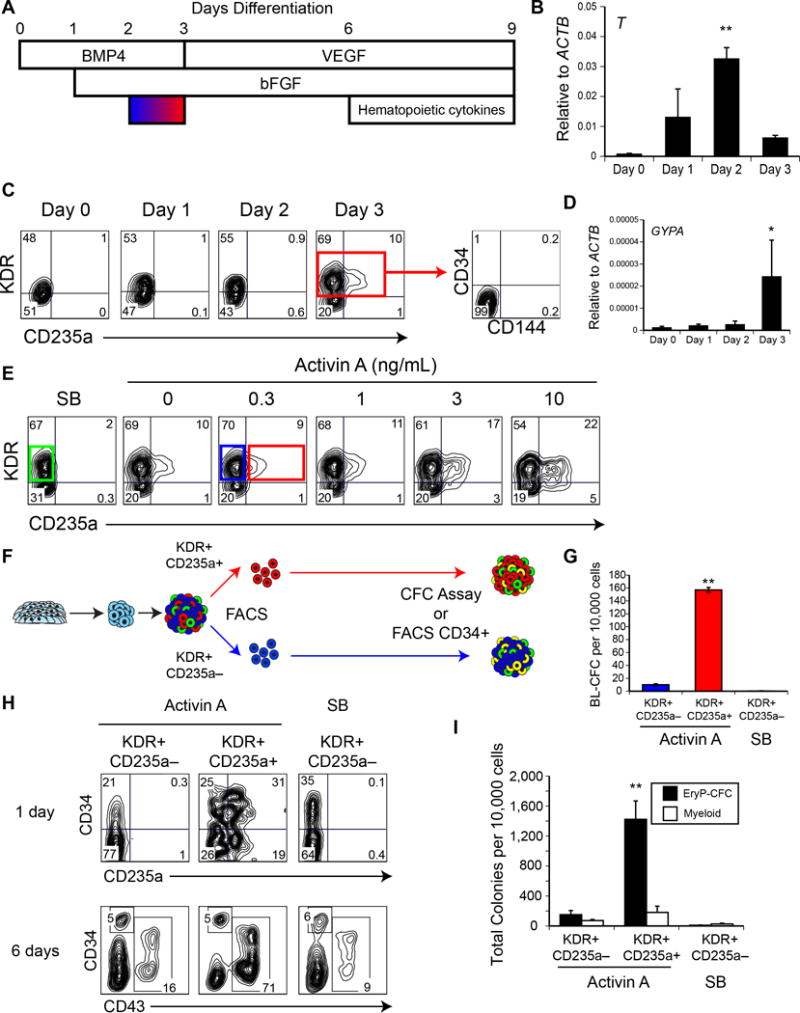
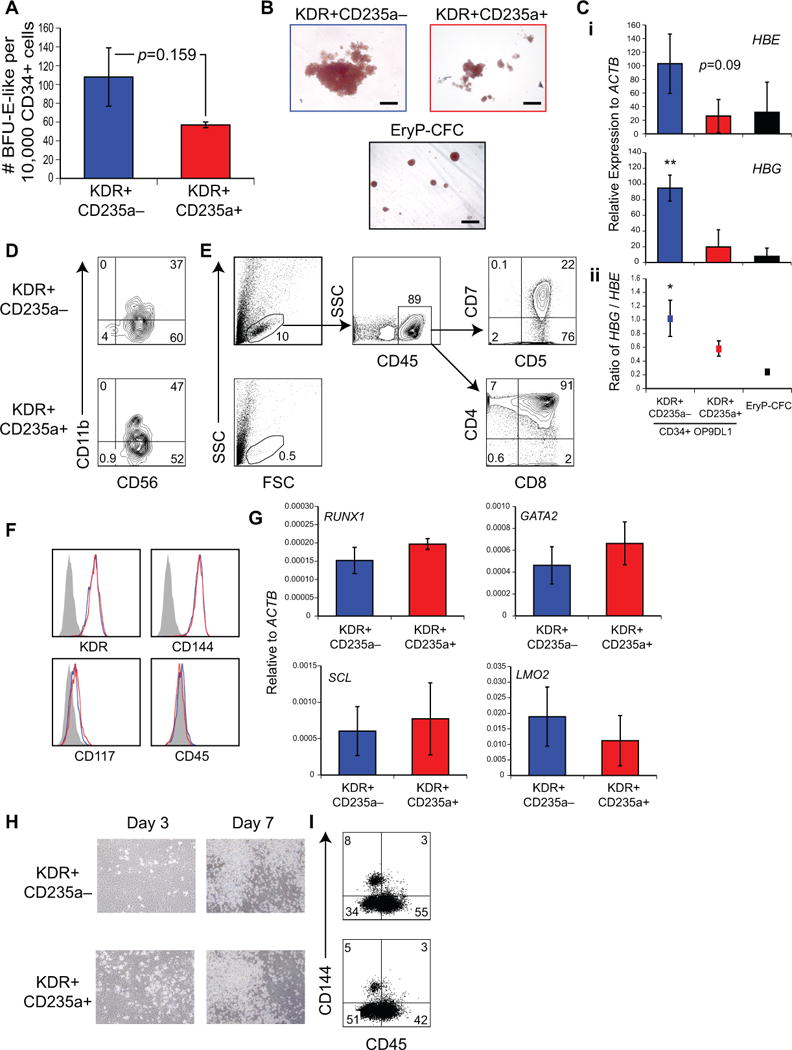
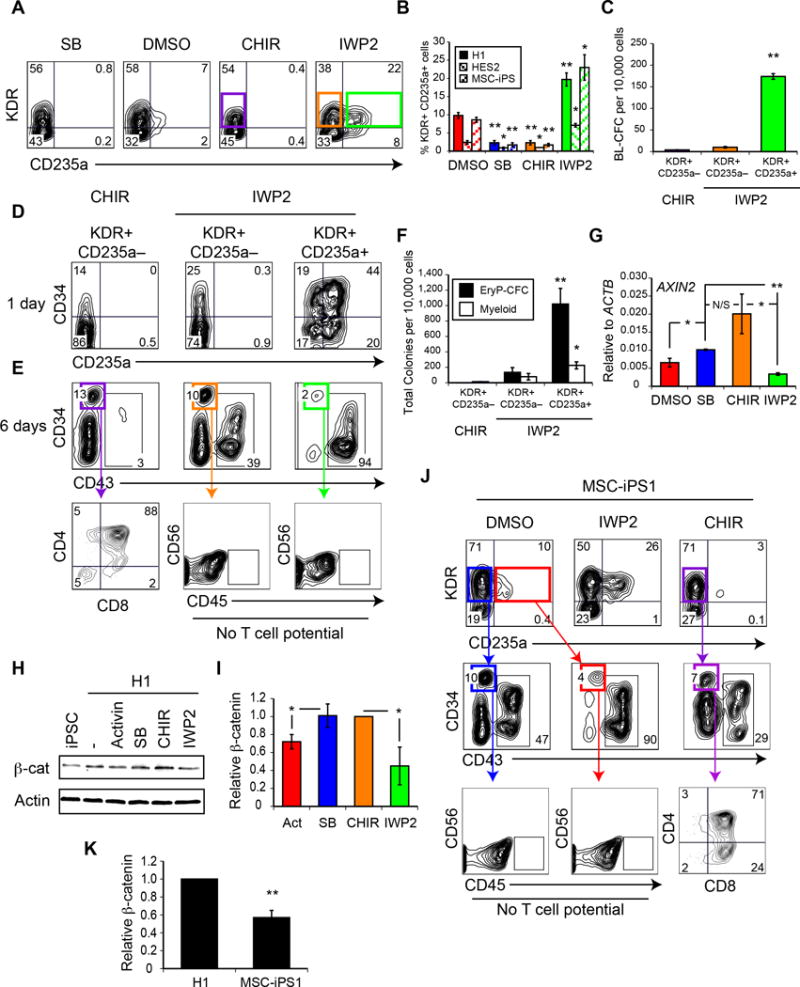
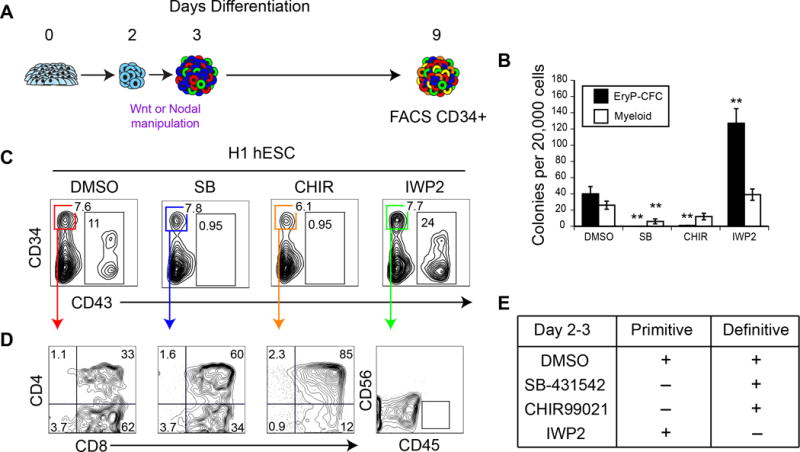
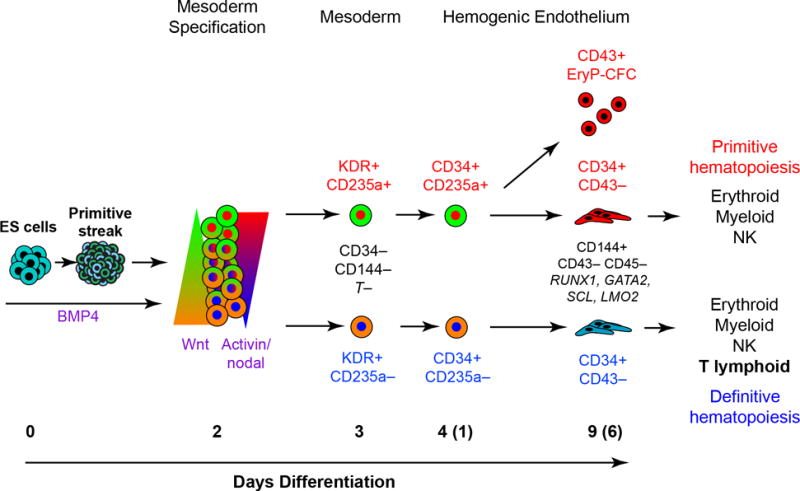
Efforts to derive hematopoietic stem cells (HSCs) from human pluripotent stem cells (hPSCs) are complicated by the fact that embryonic hematopoiesis consists of two programs, primitive and definitive, that differ in developmental potential. As only definitive hematopoiesis generates HSCs, understanding how this program develops is essential for being able to produce this cell population in vitro. Here we show that both hematopoietic programs transition through hemogenic endothelial intermediates and develop from KDR(+)CD34(-)CD144(-) progenitors that are distinguished by CD235a expression. Generation of primitive progenitors (KDR(+)CD235a(+)) depends on stage-specific activin-nodal signaling and inhibition of the Wnt-β-catenin pathway, whereas specification of definitive progenitors (KDR(+)CD235a(-)) requires Wnt-β-catenin signaling during this same time frame. Together, these findings establish simple selective differentiation strategies for the generation of primitive or definitive hematopoietic progenitors by Wnt-β-catenin manipulation, and in doing so provide access to enriched populations for future studies on hPSC-derived hematopoietic development.


Conflict of interest statement

Competing Financial Interests: The authors declare no competing financial interests.

Figures

Figure 1
Figure 1. Primitive hematopoiesis originates from a KDR+CD235a+ progenitor
(A) Serum-free differentiation schematic. Embryoid bodies were differentiated in the presence of BMP4, followed by stage-specific addition of bFGF, VEGF and hematopoietic cytokines, as illustrated. Activin-nodal signaling was manipulated between days 2 and 3 (blue-red gradient). (B) qRT-PCR of BRACHYURY (T) expression during differentiation. (C) Representative flow cytometry analysis of KDR and CD235a expression during differentiation. Day 3 KDR+ cells did not express CD34 or CD144. (D) qRT-PCR of GLYCOPHORIN A (GYPA) expression during differentiation. (E) Representative flow cytometry analysis of KDR and CD235a expression on day 3 of differentiation, with Activin-nodal signal manipulation between days 2 and 3. (F) Schematic for primitive and definitive hematopoietic potential analysis. Day 3 KDR+ populations were isolated by FACS and either analyzed for hemangioblast potential or cultured an additional 6 days, with the resultant differentiation cultures either analyzed for CFC potential, or CD34+CD43 cells were isolated by FACS. (G) Hemangioblast (BL-CFC) potential of Activin-derived KDR+CD235a (blue), KDR+CD235a+ (red), and SB-derived KDR+CD235a (green) fractions, as in (F). n = 3. (Mean ± SEM). ** ANOVA p ≤ 0.0001. (H) KDR+ populations were isolated by FACS and reaggregated and cultured as in (F), and analyzed by flow cytometry for CD34 and either CD235a (top) or CD43 expression (bottom). (I) Colony-forming progenitor potential of day 9 reaggregates, as in (H). n = 3. (Mean ± SEM). ** ANOVA p = 0.001.
Figure 2
Figure 2. KDR+CD235a mesoderm–derived CD34+CD43 cells possess definitive hematopoietic potential, but both CD34+ populations possess hemogenic endothelium-like potential
(A) Large burst-like erythroid colony-forming potential per 10,000 CD34+CD43 populations, derived as in (1F). CD34+CD43 cells derived from KDR+CD235a (blue) or KDR+CD235a+ (red) were analyzed for erythroid colony-forming potential after 7 days of co-culture with OP9-DL1. n = 3 (Mean ± SEM). Student’s t-test p = 0.16. (B) Representative erythroid colony morphology obtained following CD34+CD43 isolation (upper panels), as in (A), or of EryP-CFC (lower panel), as in (1I). Scale bar 100 μm. (C) (i) qRT-PCR of erythroid colonies for globins HBE and HBG. n = 3. (Mean ± SD). ANOVA ** p = 0.002. (ii) Ratio of HBG/HBE expression n = 3. (Mean ± SEM). ANOVA * p = 0.04. (D-E) NK/T cell potential of CD34+CD43 populations, derived as in (1F). (D) CD34+CD43 cells were analyzed for NK cell potential after 21 days OP9-DL4 co-culture. (E) CD34+CD43 cells were analyzed for T cell potential after 30+ days OP9-DL4 co-culture. (F) Flow cytometry analysis of expression of KDR, CD144, CD117 and CD45 on CD34+CD43 populations, as in (1F). Blue; KDR+CD235a derived, Red; KDR+CD235a+ derived. (G) qRT-PCR of RUNX1, GATA2, SCL and LMO2 on isolated CD34+CD43 populations, as in Figure (1F). n = 3. (Mean ± SD). Student’s t-test p > 0.05. (H,I) hemogenic endothelium potential of CD34+CD43 cells. KDR+CD235a (top) and KDR+CD235a+ (bottom) mesoderm–derived CD34+CD43 cells were isolated and plated onto thin-layer-matrigel-coated plasticware for 7 days. Adherent endothelium and non-adherent hematopoietic cells were visible (H) and examined by flow cytometry analysis for CD144 and CD45 expression after 7 days (I).
Figure 3
Figure 3. Canonical Wnt signaling specifies definitive hematopoiesis
(A) Representative flow cytometric analysis of KDR and CD235a expression in day 3 of differentiation cultures, after manipulation of Wnt signaling between days 2 and 3, as in Figure 1A, by the GSK-3 inhibitor CHIR99021 (CHIR) or the Wnt-antagonist IWP2. (B) Quantification of percentage of KDR+CD235a+ cells obtained at day 3 of differentiation in 3 different hPSC lines. n = 3. (Mean ± SEM). Student’s t-test, relative to DMSO treatment * p ≤ 0.05 ** p ≤ 0.002. (C) Hemangioblast (BL-CFC) potential of the KDR+ populations, as in (A). n = 3. (Mean ± SEM). ANOVA ** p ≤ 0.0001. (D-E) Representative flow cytometry analysis of CD34 and either CD235a (D) or CD43 (E) expression of reaggregates derived from day 3 populations, as in (A). Lower panel; T-lymphoid potential of CD34+CD43 populations, as in (1F). (F) Colony-forming progenitor potential of day 9 reaggregates derived from day 3 populations, as in (A). n = 5. (Mean ± SEM). ANOVA * p ≤ 0.05 ** p ≤ 0.0001. (G) qRT-PCR of AXIN2 expression at day 3 of differentiation following different inhibitor treatment between days 2 and 3. n = 3. (Mean ± SEM). Student’s t-test * p ≤ 0.05 ** p ≤ 0.0001 N/S p = 0.144. (H–J) Western analysis (H) of nuclear β-catenin from day 3 differentiation cultures. (I) Quantification of nuclear β-catenin, as in (H) n = 3. (Mean ± SD). Student’s t-test * p ≤ 0.05. (J) T-lymphoid potential of MSC-iPS1 differentiation cultures. Upper panel; Representative KDR and CD235a expression on day 3 differentiation cultures of the hiPSC MSC-iPS1. Middle panel; Representative day 9 reaggregate flow cytometry analysis of CD34 and CD43 expression. Lower panel; T-lymphoid potential of CD34+CD43 populations, as in (1F). (K) Quantification of nuclear β-catenin in differentiation cultures of MSC-iPS1 or H1 hESC, as in (H) n = 3. (Mean ± SD). Student’s t-test ** p ≤ 0.0001.
Figure 4
Figure 4. Wnt manipulation allows for selective differentiation of primitive or definitive hematopoietic progenitors
(A) Schematic for undisrupted embryoid body differentiation. hPSC are differentiated with Wnt activation or inhibition between days 2 and 3 of differentiation, followed by VEGF and cytokine supplementation until day 9, as in (1A). (B) Colony-forming progenitor potential of day 9 differentiation cultures, as in (A). n ≥ 5. (Mean ± SEM). Student’s t-test, relative to DMSO treatment * p ≤ 0.05 ** p ≤ 0.01. (C) Representative CD34 and CD43 expression of day 9 differentiation cultures, as in (A). (D) CD34+CD43 cells, as in (A) were analyzed for T cell potential after 28+ days OP9-DL4 co-culture. (E) Summary of hematopoietic potential following Wnt manipulation between days 2 and 3 of differentiation. CHIR99021 treatment prevents the specification of the primitive hematopoietic program while specifying the definitive program, while IWP2 prevents the specification of the definitive hematopoietic program while specifying the primitive hematopoietic program.
Figure 5
Figure 5. Model of primitive and definitive hematopoietic specification from human pluripotent stem cells
After formation of a primitive-streak-like population, KDR+CD235a+ mesoderm fated to the primitive hematopoietic lineage is specified by the combination of Activin-nodal signaling and Wnt inhibition, whereas activation of the Wnt/β-catenin specifies KDR+CD235a definitive mesoderm. The KDR+CD235a+ mesoderm gives rise to a rapid burst of primitive hematopoiesis, marked by the emergence of a CD43+ population and the development of EryP-CFCs by day 6 of culture (9 days total). In contrast, the KDR+CD235a mesoderm does not generate hematopoietic progeny during this timeframe. Following 6 days of culture, both mesodermal populations give rise to CD34+CD43 cells that expresses common markers of hemogenic endothelium, and display multi-lineage hematopoietic potential. However, only the KDR+CD235a mesoderm–derived CD34+CD43 population shows T-lymphoid potential.

Comment in

References

    1. Medvinsky A, Rybtsov S, Taoudi S. Embryonic origin of the adult hematopoietic system: advances and questions. Development (Cambridge, England) 2011;138:1017–1031. - PubMed
    1. Huber TL, Kouskoff V, Fehling HJ, Palis J, Keller G. Haemangioblast commitment is initiated in the primitive streak of the mouse embryo. Nature. 2004;432:625–630. - PubMed
    1. Lancrin C, et al. The haemangioblast generates haematopoietic cells through a haemogenic endothelium stage. Nature. 2009;457:892–895. - PMC - PubMed
    1. Antas VI, Al-Drees MA, Prudence AJ, Sugiyama D, Fraser ST. Hemogenic endothelium: a vessel for blood production. The international journal of biochemistry & cell biology. 2013;45:692–695. - PubMed
    1. Murry CE, Keller G. Differentiation of embryonic stem cells to clinically relevant populations: lessons from embryonic development. Cell. 2008;132:661–680. - PubMed

Publication types