. 2014 Jul;32(7):663-9.
doi: 10.1038/nbt.2895. Epub 2014 May 18.

A unified test of linkage analysis and rare-variant association for analysis of pedigree sequence data

Affiliations

A unified test of linkage analysis and rare-variant association for analysis of pedigree sequence data

Hao Hu et al. Nat Biotechnol. 2014 Jul.

Abstract

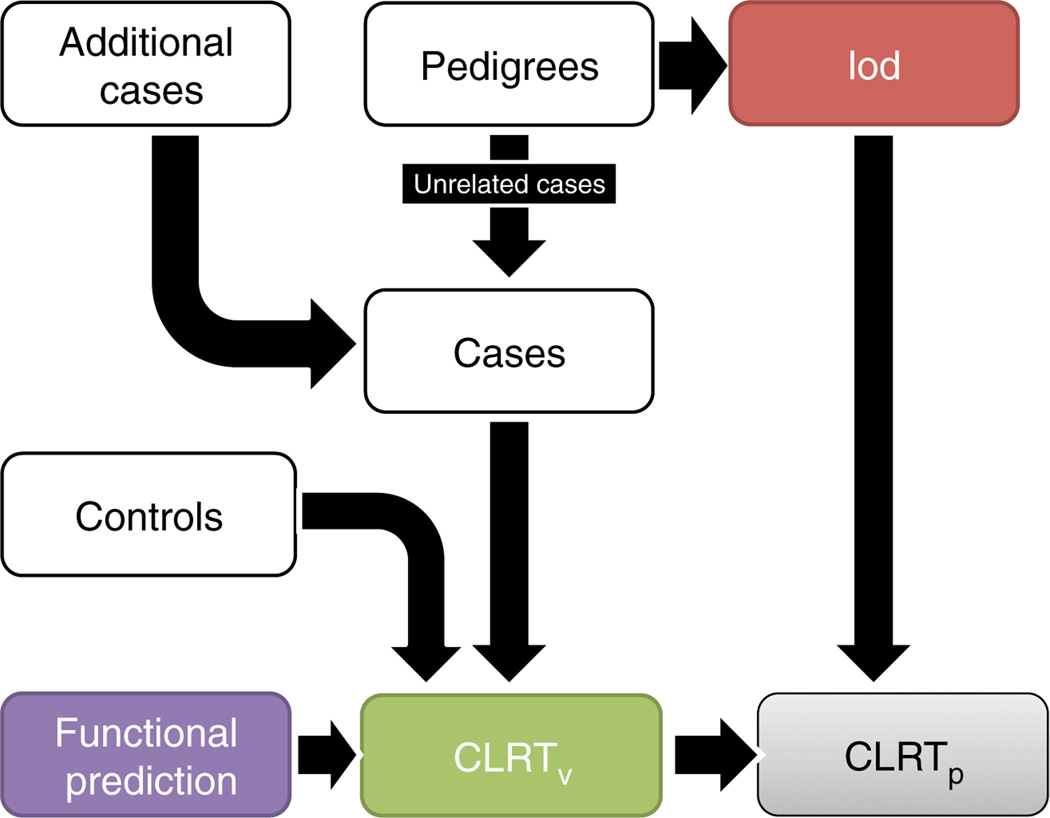
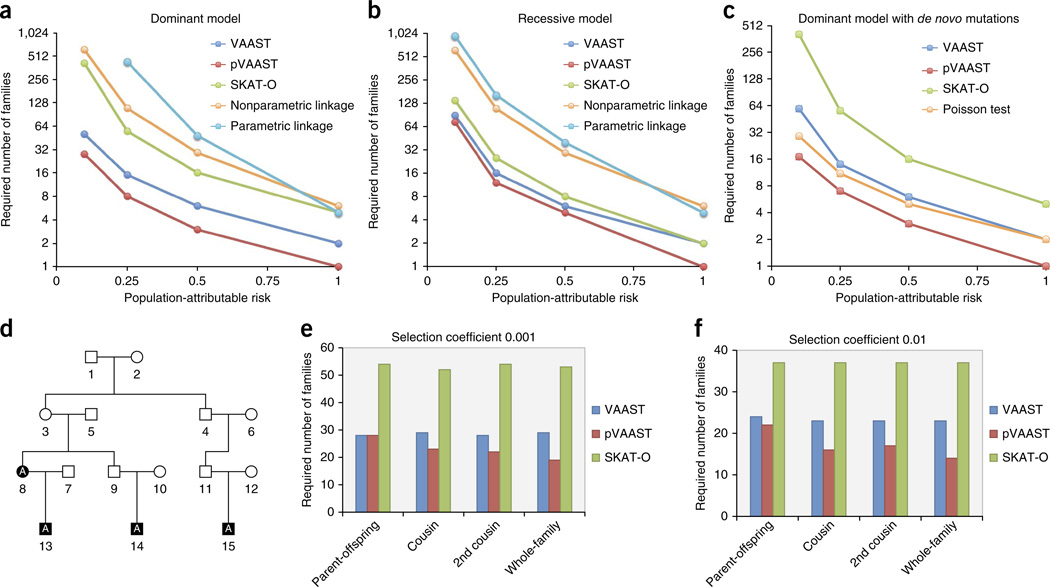
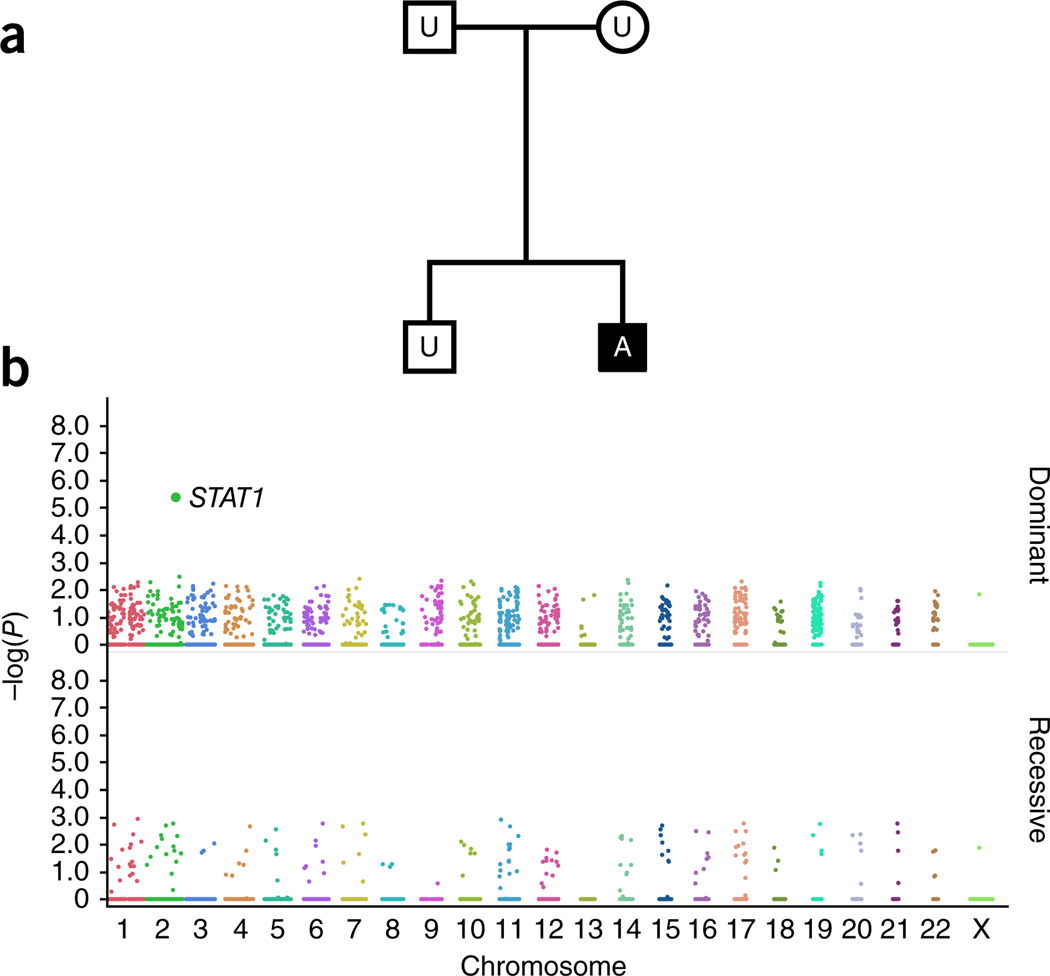
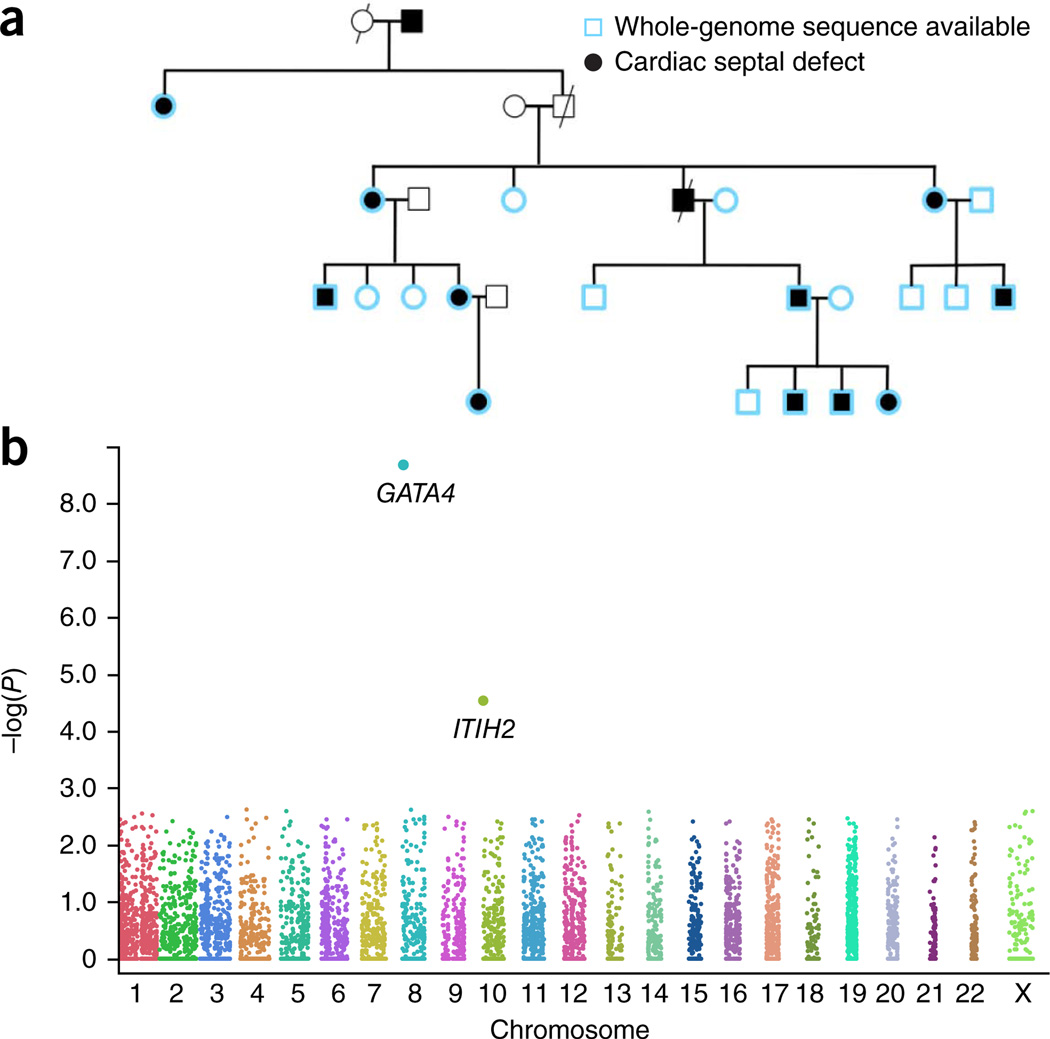
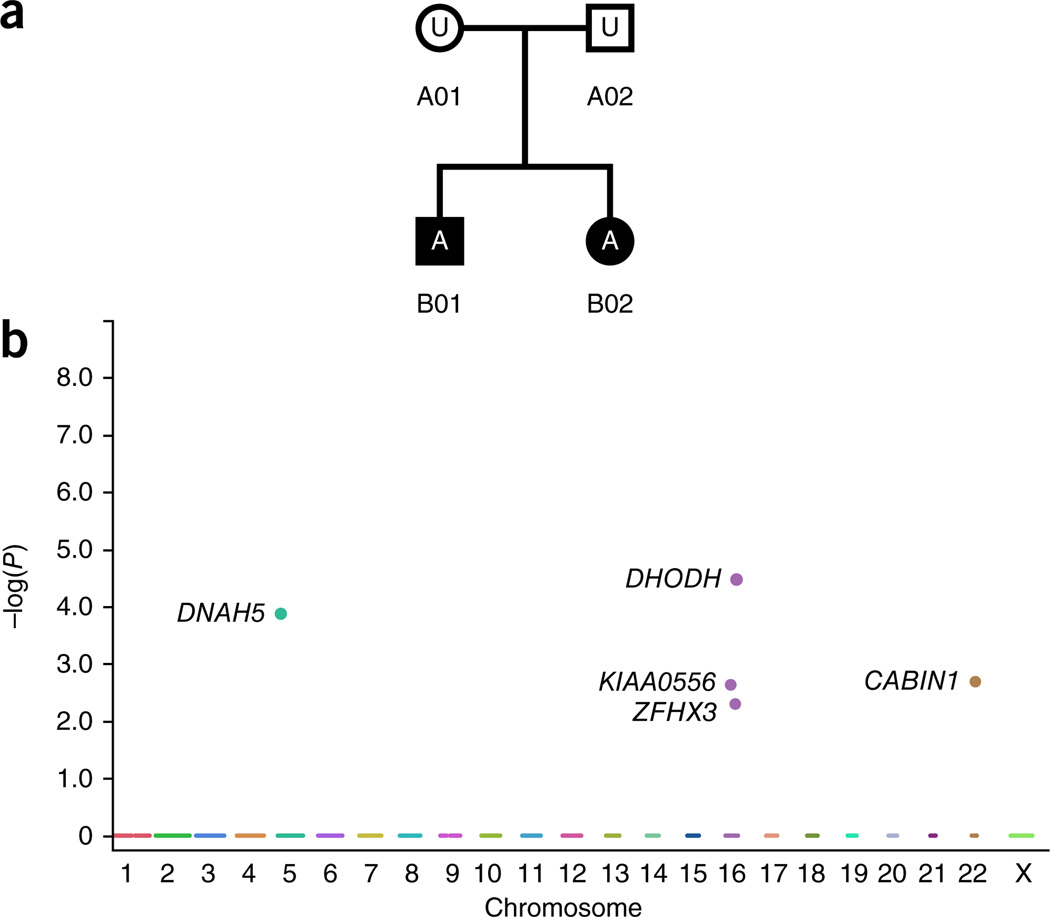
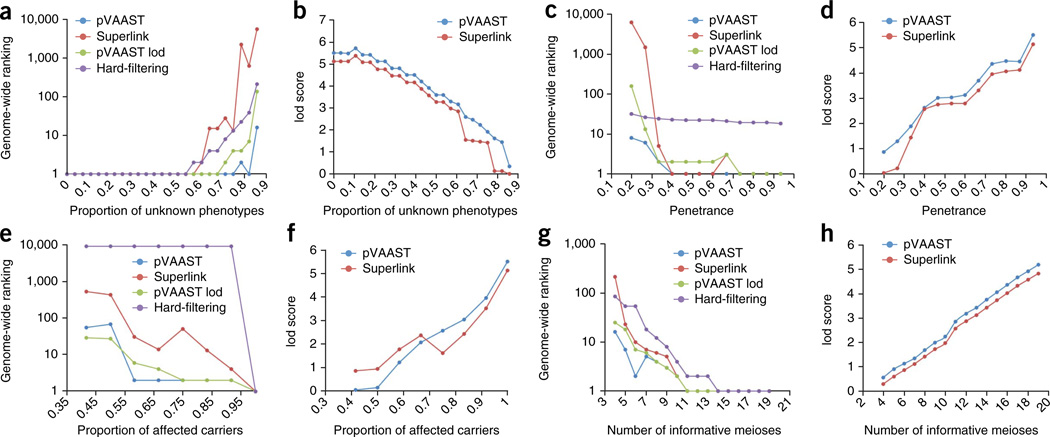
High-throughput sequencing of related individuals has become an important tool for studying human disease. However, owing to technical complexity and lack of available tools, most pedigree-based sequencing studies rely on an ad hoc combination of suboptimal analyses. Here we present pedigree-VAAST (pVAAST), a disease-gene identification tool designed for high-throughput sequence data in pedigrees. pVAAST uses a sequence-based model to perform variant and gene-based linkage analysis. Linkage information is then combined with functional prediction and rare variant case-control association information in a unified statistical framework. pVAAST outperformed linkage and rare-variant association tests in simulations and identified disease-causing genes from whole-genome sequence data in three human pedigrees with dominant, recessive and de novo inheritance patterns. The approach is robust to incomplete penetrance and locus heterogeneity and is applicable to a wide variety of genetic traits. pVAAST maintains high power across studies of monogenic, high-penetrance phenotypes in a single pedigree to highly polygenic, common phenotypes involving hundreds of pedigrees.


Figures

Figure 1
Figure 1
A schematic illustration of pVAAST. The three components of the pVAAST CLRTP are binomial likelihood test based on alleles counts in cases and controls (CLRTV), functional prediction likelihood ratio and lod score. These are summed to generate the central test statistic of pVAAST.
Figure 2
Figure 2
Rare Mendelian and common complex disease simulations, (ac) Sample sizes required to achieve 80% power by VAAST, pVAAST, SKAT-O, parametric linkage, nonparametric linkage and a Poisson-based test, in rare Mendelian disease simulations, (a) A dominant model simulation, assuming two affected cousins from each pedigree are sequenced, (b) A recessive model simulation, assuming two affected siblings from each pedigree are sequenced, (c) A de novo mutation model simulation, assuming the whole trio is sequenced and genotyping error rate is 1 × 10⁻⁵. At PAR = 0.1 in a, the required sample size to achieve 80% by the parametric linkage test is greater than the maximal sample size that we evaluated (1,000); thus we did not show this data point, (df) Benchmark experiments on simulated common complex disease pedigrees, (d) Simulated pedigree structure. Individuals labeled ‘A were always affected; other individuals were allowed to be either affected or unaffected in the rejection sampling, (e) Required sample size to achieve 80% power when selection coefficient is 0.001. (f) Required sample size to achieve 80% power when selection coefficient is 0.01. In e and f, PAR was 0.05. Sample size is defined as the number of pedigrees used for the analysis. Type I error was set to 5 × 10⁻⁴. In all experiments 1,000 control genomes were used.
Figure 3
Figure 3
pVAAST results on the enteropathy pedigree, (a) The pedigree structure. A, affected; U, unaffected, (b) The genome-wide gene P values reported by pVAAST under dominant and recessive models. The x axis shows the genomic locations arranged by chromosome.
Figure 4
Figure 4
pVAAST identifies the dominant causal gene GATA4 in cardiac septal defect pedigree, (a) Illustration of the cardiac septal defect pedigree, (b) Manhattan plot of the P values of all protein-encoding genes from the pVAAST run; each dot in the plot represents one gene. The x axis shows the genomic locations arranged by chromosome.
Figure 5
Figure 5
pVAAST identifies the recessive causal genes for Miller’s syndrome (DHODH) and primary ciliary dyskinesia (DNAH5) with a two-generation pedigree, (a) Pedigree structure. ‘A’ denotes affected individuals; ‘U’ denotes unaffected individuals, (b) Manhattan plot of the P values of all protein-encoding genes in the whole-genome run of pVAAST. Each dot represents one gene. The x axis shows the genomic locations arranged by chromosome. All four individuals in the family quartet were sequenced.
Figure 6
Figure 6
The genome-wide ranking and lod score of GATA4 in challenging situations of pedigree studies, (ah) lod scores and genome-wide rankings corresponding to differing levels of unknown phenotypes (a,b), degrees of penetrance (c,d), proportion of affected individuals being G296S mutation carriers (e,f) and number of informative meioses (g,h). For genome-wide rankings, y axis is shown in log scale, and four methods were compared (pVAAST, Superlink, pVAAST lod and a hard-filtering approach).

Similar articles

Cited by

References

    1. Borecki IB, Province MA. Linkage and association: basic concepts. Adv. Genet. 2008;60:51–74. - PubMed
    1. Muller HJ. Our load of mutations. Am. J. Hum. Genet. 1950;2:111–176. - PMC - PubMed
    1. Lee S, et al. Optimal unified approach for rare-variant association testing with application to small-sample case-control whole-exome sequencing studies. Am. J. Hum. Genet. 2012;91:224–237. - PMC - PubMed
    1. Neale BM, et al. Testing for an unusual distribution of rare variants. PLoS Genet. 2011;7:e1001322. - PMC - PubMed
    1. Ng PC, Henikoff S. Predicting the effects of amino acid substitutions on protein function. Annu. Rev. Genomics Hum. Genet. 2006;7:61–80. - PubMed

Publication types