. 2014 Jun 5;54(5):887-900.
doi: 10.1016/j.molcel.2014.04.016. Epub 2014 May 15.

RNA Bind-n-Seq: quantitative assessment of the sequence and structural binding specificity of RNA binding proteins

Affiliations

RNA Bind-n-Seq: quantitative assessment of the sequence and structural binding specificity of RNA binding proteins

Nicole Lambert et al. Mol Cell. .

Abstract

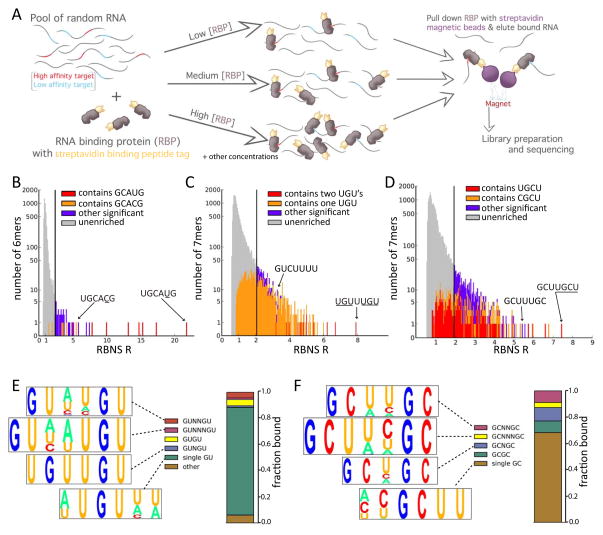
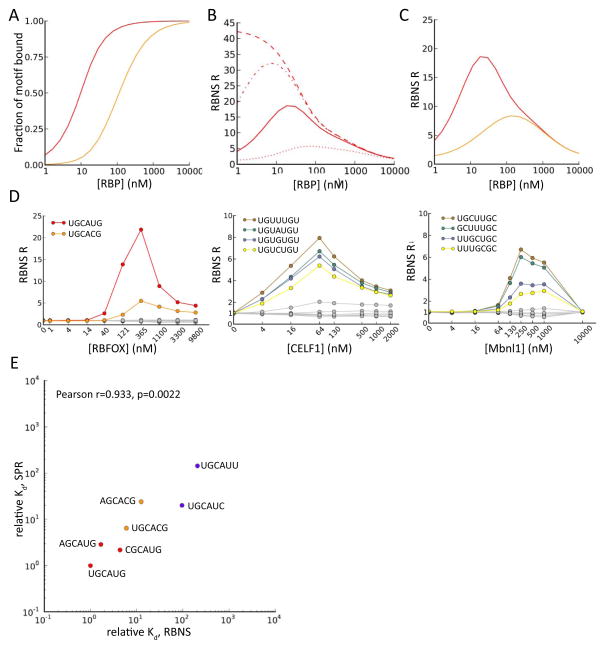
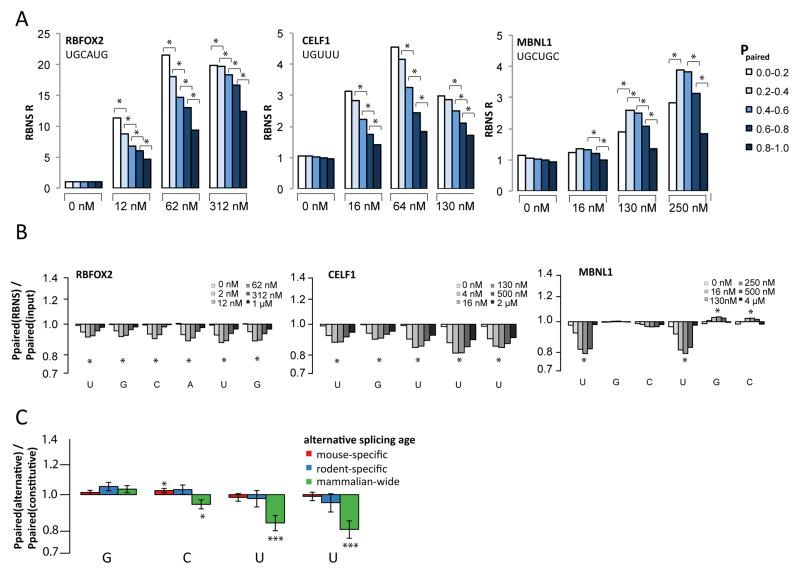
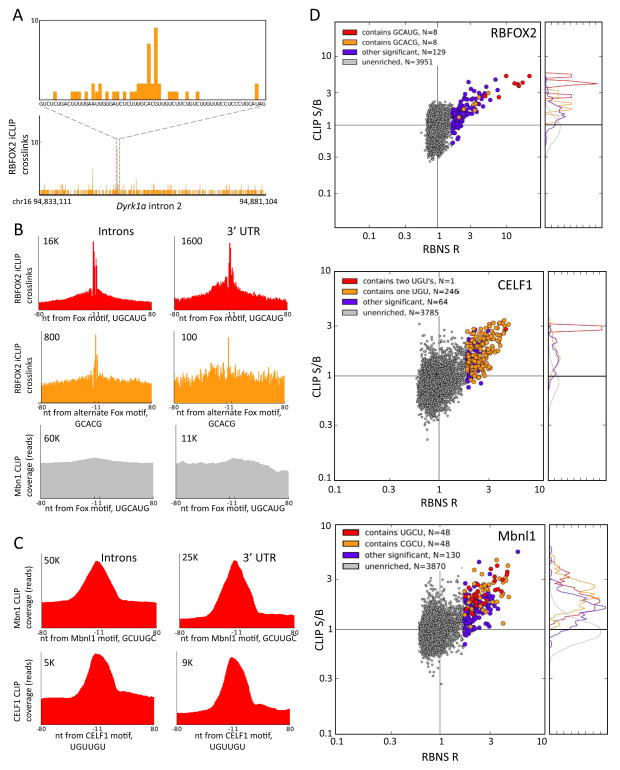
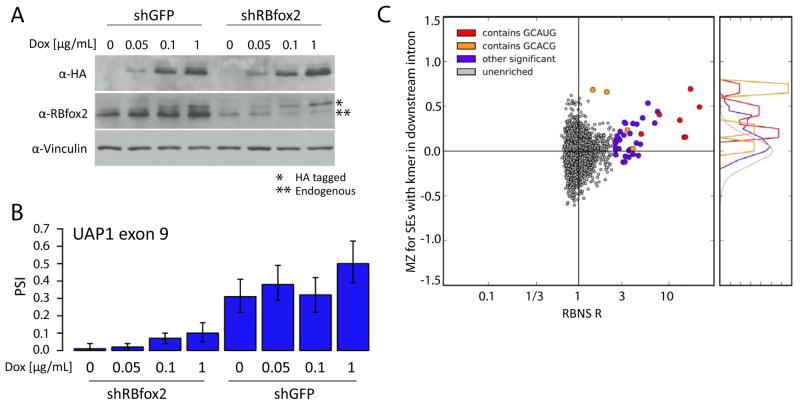
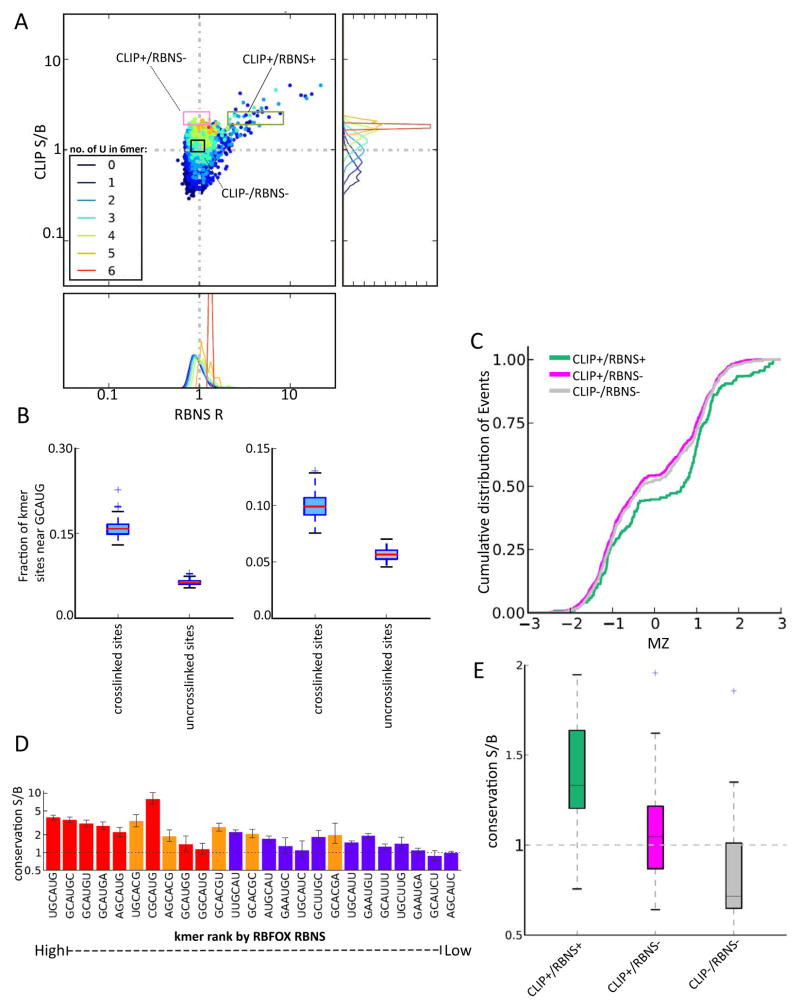
Specific protein-RNA interactions guide posttranscriptional gene regulation. Here, we describe RNA Bind-n-Seq (RBNS), a method that comprehensively characterizes sequence and structural specificity of RNA binding proteins (RBPs), and its application to the developmental alternative splicing factors RBFOX2, CELF1/CUGBP1, and MBNL1. For each factor, we recovered both canonical motifs and additional near-optimal binding motifs. RNA secondary structure inhibits binding of RBFOX2 and CELF1, while MBNL1 favors unpaired Us but tolerates C/G pairing in motifs containing UGC and/or GCU. Dissociation constants calculated from RBNS data using a novel algorithm correlated highly with values measured by surface plasmon resonance. Motifs identified by RBNS were conserved, were bound and active in vivo, and distinguished the subset of motifs enriched by CLIP-Seq that had regulatory activity. Together, our data demonstrate that RBNS complements crosslinking-based methods and show that in vivo binding and activity of these splicing factors is driven largely by intrinsic RNA affinity.


Figures

Figure 1
Figure 1. RNA Bind-n-Seq overview and motif enrichment analysis
A. Overview of the experimental method. Tagged protein is incubated with a diverse pool of RNA oligonucleotides of fixed concentration at each of several concentrations of protein. The RBP is pulled down using streptavidin-coated magnetic beads and the associated RNA is sequenced. The counts of sequences in this library are used to estimate proportions of bound RNA molecules, in comparison to input RNA, which is also sequenced. B. Stacked histogram showing the distribution of RBNS R values of all RNA 6mers in the RBFOX2 experiment at a protein concentration of 365 nM. 6mers that contain specific 5mers, whether significant or not are shown in red or orange; other 6mers are colored based on whether their R value is at least 2 SD above the mean (purple), or not (gray). A log scale is used for the Y-axis. C. As in B), but shows distribution of R values for all 7mers for CELF1 at a protein concentration of 64 nM. D. As in C), but shows distribution of all 7mers for MBNL1 at a concentration of 250 nM. E. Visualization of CELF1 binding preferences. The sequence content (displayed as a pictogram with letter height proportional to frequency), and estimated bound fraction of four groups of 7mer motifs are shown. The top 50 7mers were grouped and aligned based on their content and spacing of GU submotifs (Fig. S1D). F. Visualization of the Mbnl1 binding preferences. As in E) but based on the top 50 7mer motifs for MBNL1, grouped by spacing of GC submotifs (alignments shown in Fig. S1E). See also Figure S1.
Figure 2
Figure 2. Modeling of RBNS data and estimation of dissociation constants
A. Simulated output of RBNS under basic assumptions. Standard binding curves for two motifs of different binding affinities (see text). B. Simulated RBNS R values for a single high affinity 6mer motif as a function of protein concentration, under the assumption of different fixed amounts of nonspecific background (NSB) RNA recovery, independent of protein concentration (dashed: no NSB, dash/dot: low NSB, solid: moderate NSB, dotted: high NSB). C. Simulated RBNS R values assuming presence of a single strong motif (red) and 10 weaker motifs (orange), including moderate background nonspecific binding. D. RBNS R values for several top enriched 6mers or 7mers (colored) and several random 6mers/7mers (gray) are shown as a function of RBP concentration for each RBP studied. For RBFOX2, canonical UGCAUG and non-canonical UGCACG 6mers are shown. For CELF1, the four 7mers matching UGUNUGU are shown. For MBNL1, 7mers with two GCs at different spacings are shown, with flanking/intervening Us. E. Comparison of relative Kd values for several RBFOX2 6mers as estimated by Bind-n-seq (at RBFOX concentration 121 nM), and as measured by SPR. Correlation is significant by Pearson test (R=0.933, P=2e-3). Motifs are colored as in Figure 1B. See also Figure S4.
Figure 3
Figure 3. Impact of RNA secondary structure on recognition of RNA sequence motifs
A. Using rnafold, the average Ppaired value across the bases in each instance of the indicated motif was used to assign each motif occurrence to one of the 5 Ppaired bins indicated, and an R value was calculated at each RBP concentration for each bin as the frequency in the selected library divided by that in the input library. R values are shown for several concentrations of the three proteins, with asterisks indicating statistical significance (Z score > 2, P < 0.05) between adjacent structure bins (Methods). B. The ratio of the mean value of Ppaired in the bound library to that in the input control library is plotted on a log scale. Z scores were calculated for each selected library. Asterisks indicate bases where every selected library had |Z-score| > 2 (P < 0.05). C. As in (B) for GCUU motifs located within 130 bases downstream of alternative exons of different evolutionary ages normalized to GCUU motifs in introns downstream of constitutive exons (Merkin et al., 2012). Error bars show SEM and asterisks indicate significance by Wilcoxon rank-sum test (* P < 0.05, *** P < 0.001).
Figure 4
Figure 4. Preferential in vivo binding near RBNS motifs
A. The distribution of RBFOX2 iCLIP crosslinking sites (mESCs) in intron 2 of the mouse Dyrk1a gene, showing a peak of crosslinks near the alternate motif, GCACG (orange box). B. Meta-motif plots (cumulative number of crosslink sites) for RBFOX2 iCLIP data over all occurrences of UGCAUG (top row) in introns (left) and in 3′ UTRs (right), and similarly for the secondary motif GCACG (middle row). The bottom row shows a negative control: meta-motif plot of MBNL1 CLIP data (mouse myoblasts) in the vicinity of the RBFOX motif, UGCAUG. Numbers indicate y-axis scale. C. Meta-motif plot of MBNL1 CLIP-seq coverage in the vicinity of the top MBNL 6mer, GCUUGC, in introns and 3′ UTRs (top row); similar data for CELF1 CLIP-Seq (mouse myoblasts) in the vicinity of the top CELF1 6mer, UUUUGU (bottom row). D. Scatter plots of CLIP-Seq S/B (Methods) versus RBNS R values for each protein analyzed, using same concentrations as in Figure 1, but using 6mers rather than 7mers for CELF1 and MBNL1 to increase statistical power of CLIP S/B analysis. Top: RBFOX2 iCLIP data in introns. Middle: CELF1 CLIP data in introns. Bottom: MBNL1 CLIP data in 3′ UTRs. All significant 6mers containing the indicated submotifs are colored in red, orange, or purple; all non-significant 6mers are in gray. Histograms at right show the normalized distributions of CLIP S/B for the corresponding color-coded groups of 6mers. See also Figure S5.
Figure 5
Figure 5. Splicing regulatory activity of RNA motifs from analysis of splicing factor perturbation data
A. Western analysis of Rbfox2 in tet-inducible Rbfox2 mESC lines. Cells were treated with either a control hairpin targeting GFP (left lanes) or a hairpin targeting endogenous Rbfox2 mRNAs (right lanes). Cells were treated with 0, 0.05, 0.1 or 1 μg/mL of Dox to induce exogenous FLAG-tagged Rbfox2. Western shows endogenous and tagged Rbfox2 as well as a loading control (Vinculin). B. The percent spliced in (PSI) values shown for a highly Rbfox2-sensitive alternative exon in pyrophosphorylase Uap1 in mESCs at each of the 8 different Rbfox2 levels shown above (2 hairpins × 4 levels of Dox). Error bars show 95% confidence intervals. C. Distribution of RBFOX2 monotonicity Z-scores (Methods) versus RBFOX2 RBNS R values for all 6mers. MZ scores were calculated for 1442 skipped exons in mESC-expressed genes using the Rbfox2 perturbation system shown in A). For each 6mer, the average MZ score of all exons which had the 6mer in the first 200 bases of the downstream intron was calculated. Coloring as in Figure 5. RBNS-enriched 6mers had significantly higher MZ scores than unenriched 6mers (KS test, p=2e-7). See also Figure S6.
Figure 6
Figure 6. RBNS distinguishes subsets of CLIP-seq motifs with and without regulatory activity
A. RBFOX2 iCLIP S/B in 3′ UTRs is plotted against RBFOX2 RBNS R value for all 6mers (as in Fig. 4D), with points colored by the number of U bases present in the 6mer as indicated. The distribution of iCLIP S/B values is shown at right, and the distribution of RBNS R values are shown below, for each group of 6mers binned by U content. Log scale is used on both axes. B. RBFOX primary motifs have increased frequency near crosslinked CLIP+/RBNS− sequences. For each CLIP+/RBNS− motif in either introns (left) or 3′ UTRs (right), the fraction of motifs that had a GCAUG within 40 nt was calculated for all motif occurrences that were crosslinked in iCLIP or uncrosslinked. C. Cumulative distribution of MZ scores for sets of alternative exons grouped by presence of specific 6mer motifs in first 200 nt of downstream intron. Groups of 6mers are colored as in A). D. Conservation S/B of the top RBFOX2 6mer motifs by RBNS in mammalian 3′ UTRs. Motifs are listed in descending order of R value and colored as in previous figures. E. Box plots of the distributions of conservation S/B for 6mers grouped as in A).

References

    1. Auweter SD, Fasan R, Reymond L, Underwood JG, Black DL, Pitsch S, Allain FH. Molecular basis of RNA recognition by the human alternative splicing factor Fox-1. EMBO J. 2006;25:163–173. - PMC - PubMed
    1. Baraniak AP, Chen JR, Garcia-Blanco MA. Fox-2 mediates epithelial cell-specific fibroblast growth factor receptor 2 exon choice. Mol Cell Biol. 2006;26:1209–1222. - PMC - PubMed
    1. Campbell ZT, Bhimsaria D, Valley CT, Rodriguez-Martinez JA, Menichelli E, Williamson JR, Ansari AZ, Wickens M. Cooperativity in RNA-protein interactions: global analysis of RNA binding specificity. Cell reports. 2012;1:570–581. - PMC - PubMed
    1. Cass D, Hotchko R, Barber P, Jones K, Gates DP, Berglund JA. The four Zn fingers of MBNL1 provide a flexible platform for recognition of its RNA binding elements. BMC Mol Biol. 2011;12:20. - PMC - PubMed
    1. Daughters RS, Tuttle DL, Gao W, Ikeda Y, Moseley ML, Ebner TJ, Swanson MS, Ranum LP. RNA gain-of-function in spinocerebellar ataxia type 8. PLoS genetics. 2009;5:e1000600. - PMC - PubMed

Publication types

Associated data