. 2014 Oct 1;23(19):5109-22.
doi: 10.1093/hmg/ddu235. Epub 2014 May 16.

A C. elegans model of human α1-antitrypsin deficiency links components of the RNAi pathway to misfolded protein turnover

Affiliations

A C. elegans model of human α1-antitrypsin deficiency links components of the RNAi pathway to misfolded protein turnover

Olivia S Long et al. Hum Mol Genet. .

Abstract

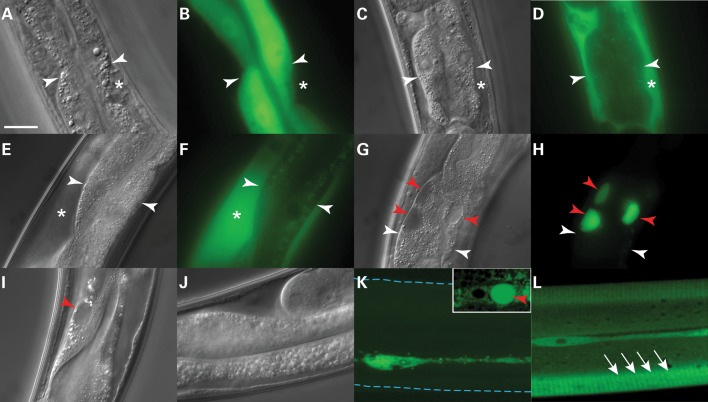
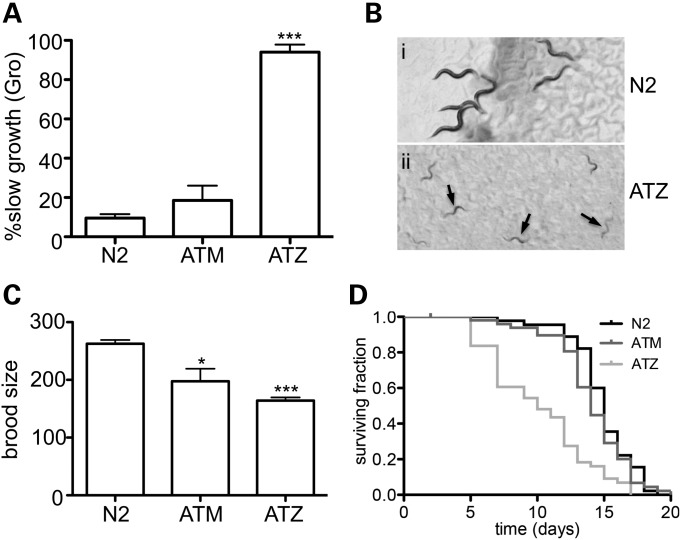
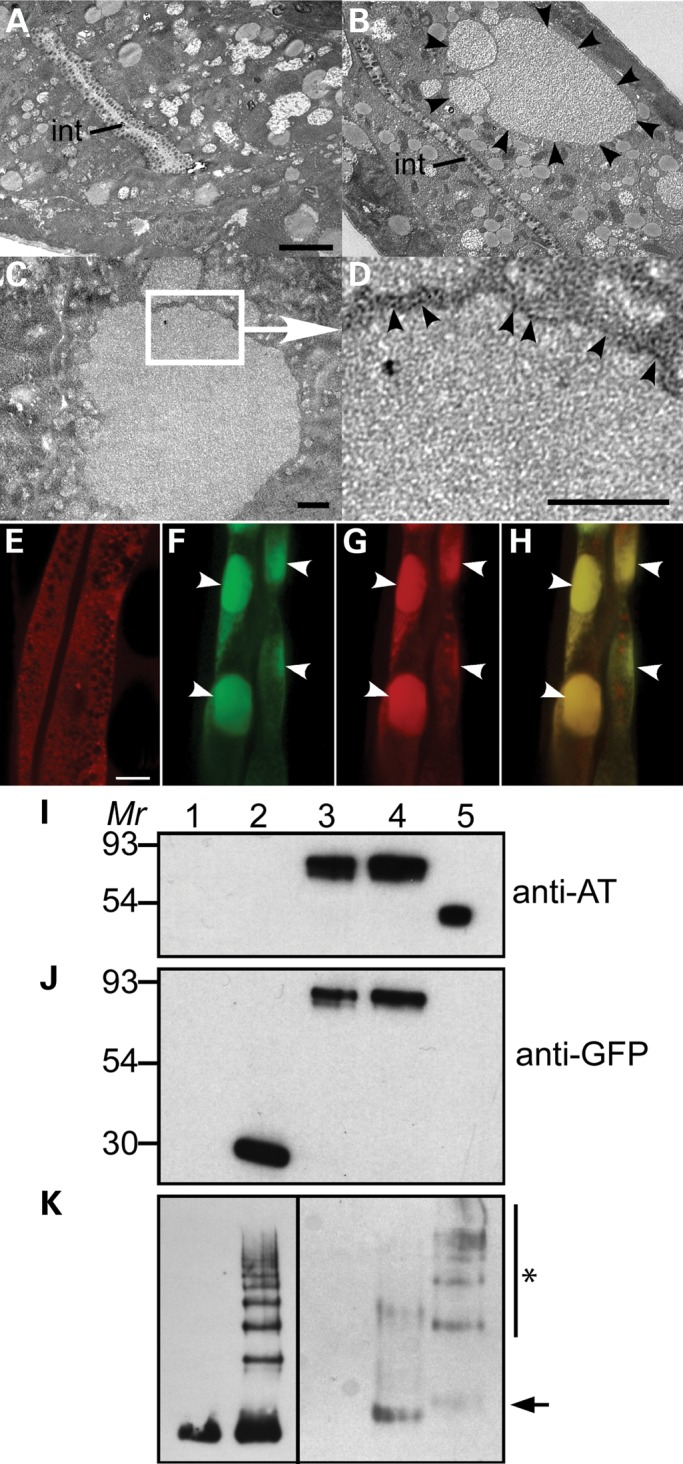
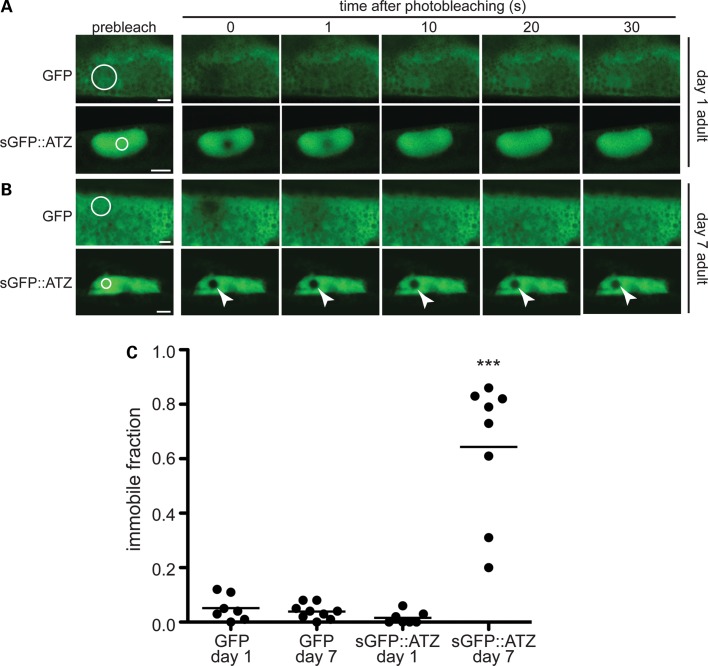
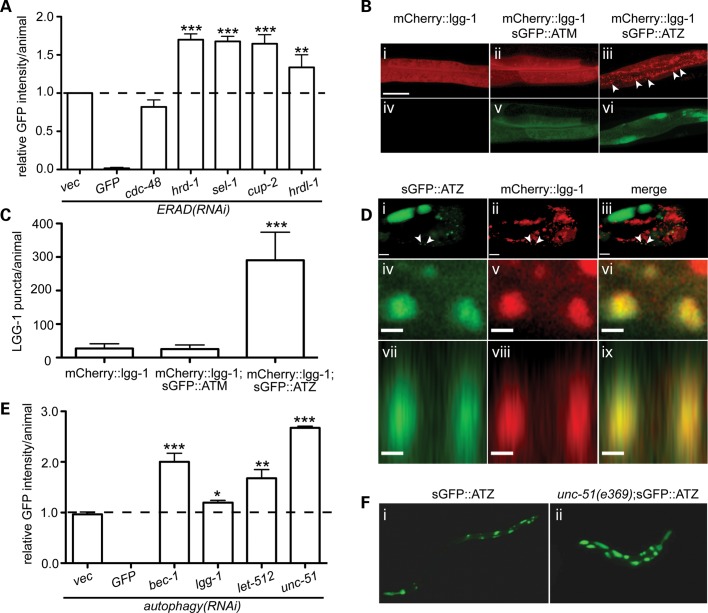
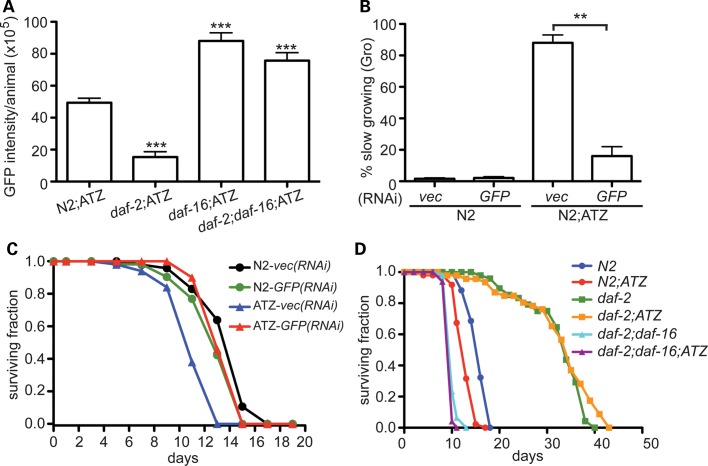
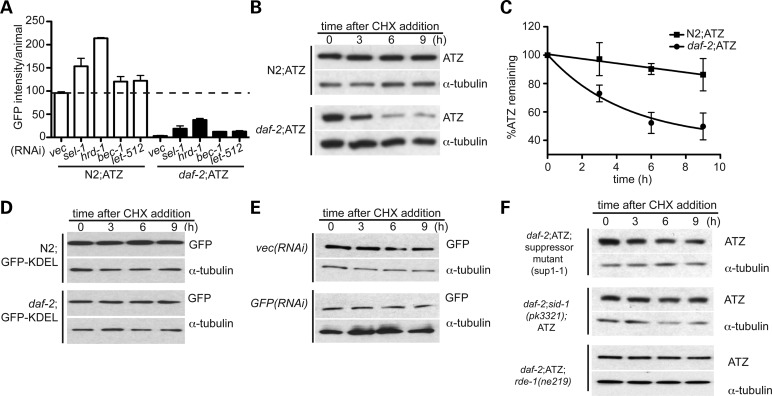
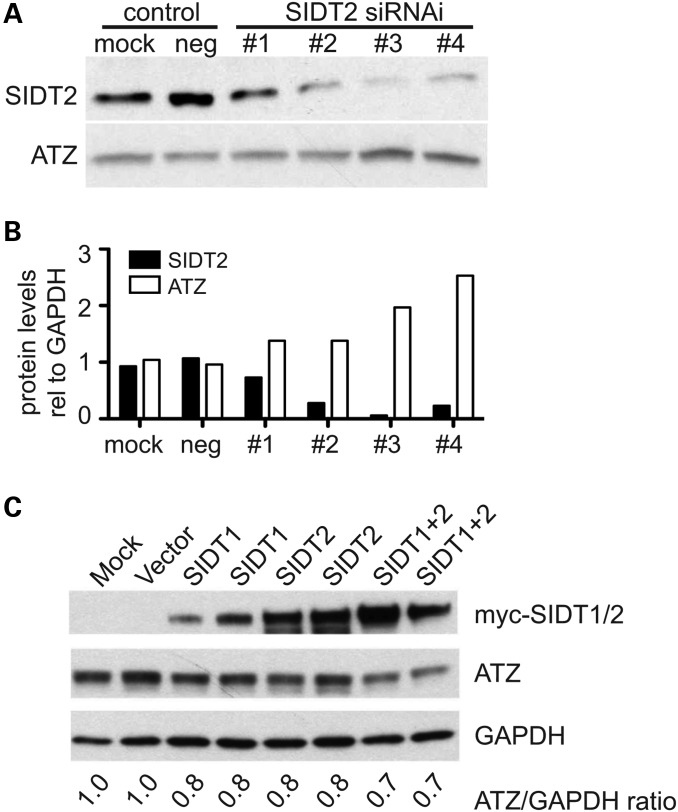
The accumulation of serpin oligomers and polymers within the endoplasmic reticulum (ER) causes cellular injury in patients with the classical form α1-antitrypsin deficiency (ATD). To better understand the cellular and molecular genetic aspects of this disorder, we generated transgenic C. elegans strains expressing either the wild-type (ATM) or Z mutant form (ATZ) of the human serpin fused to GFP. Animals secreted ATM, but retained polymerized ATZ within dilated ER cisternae. These latter animals also showed slow growth, smaller brood sizes and decreased longevity; phenotypes observed in ATD patients or transgenic mouse lines expressing ATZ. Similar to mammalian models, ATZ was disposed of by autophagy and ER-associated degradation pathways. Mutant strains defective in insulin signaling (daf-2) also showed a marked decrease in ATZ accumulation. Enhanced ATZ turnover was associated with the activity of two proteins central to systemic/exogenous (exo)-RNAi pathway: the dsRNA importer, SID-1 and the argonaute, RDE-1. Animals with enhanced exo-RNAi activity (rrf-3 mutant) phenocopied the insulin signaling mutants and also showed increased ATZ turnover. Taken together, these studies allude to the existence of a novel proteostasis pathway that mechanistically links misfolded protein turnover to components of the systemic RNAi machinery.


Figures

Figure 1.
Figure 1.
Imaging of transgenic animals expressing (s)GFP::AT transgenes. Widefield DIC and fluorescence images of animals expressing GFP (A and B), sGFP (C and D), sGFP::ATM (E and F) or sGFP::ATZ (G and H) under the control of the intestine-specific nhx-2 promoter. White arrowheads and asterisks highlight intestinal cell plasma membrane and pseudo-coelomic space, respectively. Red arrows show intracellular, sGFP::ATZ-positive inclusions. DIC images of sATZ (I) or sATM (J) in the intestine. Intracellular inclusions containing ATZ are highlighted with a red arrowhead (I). Confocal images of hypodermal seam cells of animals expressing sGFP::ATZ (K) or sGFP::ATM (L) under the control of the srp-2 promoter. Images are maximum intensity projections of all the z-stacks. Blue dashed lines delineate worm cuticle (K), which was not visible at this exposure. Note the presence of a large intracellular inclusion in the seam cell of an animal expressing sGFP::ATZ (K, inset, red arrowhead) and secreted protein in the cuticular annuli of an animal expressing sGFP::ATM (L, white arrows). Scale bar, 20 µm.
Figure 2.
Figure 2.
Phenotypes associated with animals expressing sGFP::ATZ. Animals expressing sGFP::ATZ displayed developmental abnormalities as assessed by slow growth (Gro) throughout larval development (A). Animals were classified as slow growing if they had not reached the L4 stage by 48 h. DIC images of N2 (B, i) and sGFP::ATZ (B, ii) animals 48 h post egg lay. Black arrows point to slow growing sGFP::ATZ animals (B, ii). Brood size of N2, sGFP::ATM and sGFP::ATZ animals (C). Significance determined using an unpaired, two-tailed, Student's t-test, *P < 0.05, ***P < 0.001. Kaplan–Meier survival curves of N2 (black), sGFP::ATM (dark gray) and sGFP::ATZ (light gray) animals (D). Survival of sGFP::ATZ animals was significantly shorter than that of N2 animals (Mantel–Cox log-rank test, P < 0.001).
Figure 3.
Figure 3.
sGFP::ATZ is retained in the ER. Transmission electron micrographs showing a transverse section of the intestine of animals expressing sGFP::ATM (A) and sGFP::ATZ (BD). Large protein dense inclusions (black arrowheads) were present in animals expressing sGFP::ATZ (B). int, intestinal lumen. Scale bar, 2 µm. Higher magnification images (C and D) indicate that the inclusions were surrounded with ribosome-rich membranes indicative of the ER (black arrowheads). Scale bars, 0.5 µm. Widefield fluorescence image of a transgenic animals expressing DsRED-KDEL (E). A diffuse reticular expression pattern is consistent with ER localization. Images of a transgenic animal co-expressing DsRED-KDEL and sGFP::ATZ in the green channel (F), red channel (G) and merge (H), respectively, showed co-localization of intracellular inclusions (white arrowheads). Immunoblots of lysates from transgenic animals (IK). Lysates of N2 (lane 1) and transgenic animals expressing sGFP (lane 2), sGFP::ATM (lane 3) and sGFP::ATZ (lane 4) were separated by SDS–PAGE under denaturing conditions (I and J). AT purified from plasma was included in lane 5 as a positive control. AT and GFP protein bands were detected by probing with anti-AT (I) and anti-GFP (J) antibodies, respectively. Native PAGE analysis of animal lysates (K). Monomeric (lane 1) and polymeric (lane 2) AT were included as controls. Lysates of N2 (lane 3) and transgenic animals expressing sGFP::ATM (lane 4) and sGFP::ATZ (lane 5) were separated under non-denaturing conditions. Arrow indicates monomeric sGFP::AT and asterisk AT-polymers.
Figure 4.
Figure 4.
ATZ FRAP analysis. The immobile fraction of sGFP::ATZ expressing day 7 adults was significantly greater than that of the day 1 animals (two-tailed, non-parametric Mann–Whitney test, ***P < 0.001). Representative FRAP time course images of day 1 (A) and day 7 (B) adults expressing either GFP (upper panels) or sGFP::ATZ (lower panels). Pre-bleach images were taken prior to photobleaching in the region of interest (ROI) (white circles). Fluorescence recovery was monitored for the times shown. Note the lack of fluorescence recovery in day 7 sGFP::ATZ animals (white arrowheads). Scale bar, 5 µm. The non-diffusible/immobile fraction of ATZ protein following FRAP analysis (C).
Figure 5.
Figure 5.
Role of ERAD and autophagy in sGFP::ATZ clearance. Effect of ERAD RNAi's on sGFP::ATZ accumulation in sGFP::ATZ expressing animals (A). LGG-1 positive puncta were increased in animals expressing sGFP::ATZ (B). Confocal z-series of the posterior intestinal region of transgenic animals expressing lgg-1::mCherry alone (i and iv) and with sGFP::ATM (ii and v) or sGFP::ATZ (iii and vi). Images were maximum intensity projections of all the z-stacks with the scale bar representing 20 µm. Note the marked increase in number of mCherry::LGG-1 puncta in animals expressing sGFP::ATZ (iii, arrowheads and C). Quantification of the number of LGG-1 puncta in the different transgenic lines (C). The statistical significance of data in A, C and E was determined using an unpaired, two-tailed, Student's t-test, *P < 0.05, **P < 0.01 and ***P < 0.001. Autophagasomes co-localized with sGFP::ATZ inclusions (D). Representative single plane confocal images of a single intestinal cell of a transgenic animal expressing sGFP::ATZ and LGG-1::mCherry. The scale bar represents 10 µm. Arrowheads point to two puncta that were examined for co-localization of sGFP::ATZ and LGG-1::mCherry (D, i–iii). Higher magnification images of the two puncta in the X-Y (iv, v and vi) and X-Z (vii, viii and ix) planes. Note co-localization of red and green signals to the two puncta (yellow in merge). The scale bar represents 1 µm. Effect of autophagy RNAi on sGFP::ATZ accumulation (E). sGFP::ATZ accumulation was also increased in autophagy-deficient animals (F). GFP fluorescence images of Pnhx2sGFP::ATZ (i) and unc-51(e369);Pnhx2sGFP::ATZ (ii) animals.
Figure 6.
Figure 6.
Role of insulin/insulin growth factor (IGF)-1-like signaling (IIS) pathway on ATZ accumulation. Relative expression of sGFP::ATZ in various genetic backgrounds measured using the ArrayScanVTI (A). Effect of vec and GFP RNAis on PED (B) and longevity (C). The statistical significance of data in (A) and (B) was determined using an unpaired, two-tailed, Student's t-test, *P < 0.05 and ***P < 0.001. Longevity of sGFP::ATZ animals crossed with various IIS mutants (D).
Figure 7.
Figure 7.
Suppression of ATZ clearance by the RNAi pathway. Effect of ERAD and autophagy RNAis on ATZ accumulation in N2 (white) and daf-2 mutant (black) background (A). sGFP::ATZ half-life in N2 (upper panels) and daf-2 mutant (lower panels) background (B). Graph showing remaining ATZ following CHX inhibition (C). sGFP-KDEL half-life in N2 (upper panels) and daf-2 mutant (lower panels) background (D). Note, unlike sGFP::ATZ, the half-life of sGFP-KDEL is not accelerated in daf-2 mutants. Effect of reduced steady-state expression on sGFP::ATZ half-life (E). Note, ATZ half-life is not dependent on steady-state expression levels. Effect of SID-1 and RDE-1 on ATZ half-life (F). Note, the accelerated clearance of ATZ in the daf-2 background is suppressed by sid-1(pk3321) and rde-1(ne219) mutations. *Note: steady-state ATZ levels in daf-2 mutants and GFP(RNAi)-treated animals were considerably lower, as such more total lysates were loaded for these samples to ensure comparable ATZ levels at t = 0. This is reflected in the higher levels of tubulin in the above-mentioned samples.
Figure 8.
Figure 8.
Role of mammalian SIDT1/2 on ATZ clearance. Effect of SIDT2 knock-down in HeLa cells expressing ATZ (A and B). HTO/Z cells were transiently transfected with scramble (neg) or SIDT2 siRNA and SIDT2 and ATZ protein levels were assessed via western blot analysis. Following siRNA treatment, SIDT2 was significantly down-regulated in transfected cells (A, upper panel and B, black bars). Silencing of SIDT2 also resulted in approximately 2-fold increases in the total ATZ level (A, lower panel and B, white bars). To further test the effect of SIDT1/2 on ATZ accumulation, HTO/Z cells were transfected with constructs expressing SIDT1 and/or SIDT2. Cells expressing SIDT1 or SIDT2 showed ∼20% decrease in ATZ accumulation (C). Cells expressing both SIDT1 and SIDT2 showed ∼30–35% decrease in ATZ accumulation.

References

    1. Carrell R.W., Lomas D.A. Conformational disease. Lancet. 1997;350:134–138. - PubMed
    1. Luisetti M., Seersholm N. Alpha1-antitrypsin deficiency. 1: epidemiology of alpha1-antitrypsin deficiency. Thorax. 2004;59:164–169. - PMC - PubMed
    1. Perlmutter D.H., Silverman G.A. Hepatic fibrosis and carcinogenesis in alpha1-antitrypsin deficiency: a prototype for chronic tissue damage in gain-of-function disorders. Cold Spring Harb. Perspect. Biol. 2011;3:181–194. - PMC - PubMed
    1. Rudnick D.A., Perlmutter D.H. Alpha-1-antitrypsin deficiency: a new paradigm for hepatocellular carcinoma in genetic liver disease. Hepatology. 2005;42:514–521. - PubMed
    1. Perlmutter D.H. Liver injury in alpha1-antitrypsin deficiency: an aggregated protein induces mitochondrial injury. J. Clin. Invest. 2002;110:1579–1583. - PMC - PubMed

Publication types

MeSH terms