. 2014 Sep;234(1):60-73.
doi: 10.1002/path.4375. Epub 2014 Jul 9.

Pivotal role of MUC1 glycosylation by cigarette smoke in modulating disruption of airway adherens junctions in vitro

Affiliations

Pivotal role of MUC1 glycosylation by cigarette smoke in modulating disruption of airway adherens junctions in vitro

Lili Zhang et al. J Pathol. 2014 Sep.

Abstract

Cigarette smoke increases the risk of lung cancer by 20-fold and accounts for 87% of lung cancer deaths. In the normal airway, heavily O-glycosylated mucin-1 (MUC1) and adherens junctions (AJs) establish a structural barrier that protects the airway from infectious, inflammatory and noxious stimuli. Smoke disrupts cell-cell adhesion via its damaging effects on the AJ protein epithelial cadherin (E-cad). Loss of E-cad is a major hallmark of epithelial-mesenchymal transition (EMT) and has been reported in lung cancer, where it is associated with invasion, metastasis and poor prognosis. Using organotypic cultures of primary human bronchial epithelial (HBE) cells treated with smoke-concentrated medium (Smk), we have demonstrated that E-cad loss is regulated through the aberrant interaction of its AJ binding partner, p120-catenin (p120ctn), and the C-terminus of MUC1 (MUC1-C). Here, we reported that even before MUC1-C became bound to p120ctn, smoke promoted the generation of a novel 400 kDa glycoform of MUC1's N-terminus (MUC1-N) differing from the 230 kDa and 150 kDa glycoforms in untreated control cells. The subsequent smoke-induced, time-dependent shedding of glycosylated MUC1-N exposed MUC1-C as a putative receptor for interactions with EGFR, Src and p120ctn. Smoke-induced MUC1-C glycosylation modulated MUC1-C tyrosine phosphorylation (TyrP) that was essential for MUC1-C/p120ctn interaction through dose-dependent bridging of Src/MUC1-C/galectin-3/EGFR signalosomes. Chemical deglycosylation of MUC1 using a mixture of N-glycosylation inhibitor tunicamycin and O-glycosylation inhibitor benzyl-α-GalNAc disrupted the Src/MUC1-C/galectin-3/EGFR complexes and thereby abolished smoke-induced MUC1-C-TyrP and MUC1-C/p120ctn interaction. Similarly, inhibition of smoke-induced MUC1-N glycosylation using adenoviral shRNA directed against N-acetyl-galactosaminyl transferase-6 (GALNT6, an enzyme that controls the initiating step of O-glycosylation) successfully suppressed MUC1-C/p120ctn interaction, prevented E-cad degradation and maintained cellular polarity in response to smoke. Thus, GALNT6 shRNA represents a potential therapeutic modality to prevent the initiation of events associated with EMT in the smoker's airway.

Keywords: E-cadherin; EGFR; MUC1; cigarette smoke; epithelial-mesenchymal transition; galectin-3; glycosylation; in vitro airway model; lung cancer; p120-catenin.


Conflict of interest statement

No conflicts of interest were declared.

Figures
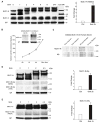
Figure 1
Figure 1
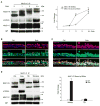
Smoke induces expression and shedding of a 400kDa glycoform of MUC1-N. (A) Pseudostratified HBE cells exposed to smoke-concentrated medium (Smk) were harvested at the indicated time points and immunoprecipitated (IP) using an antibody directed against MUC1-C (MUC1-CT2). MUC1-C IP was probed with antibodies directed against the tandem repeat core of MUC1-N (VU4H5) and MUC1-C. VU4H5 recognized 400kDa, 230kDa and 150kDa isoforms of MUC1-N, while anti-MUC1-C recognized a smear of bands between 20kDa and 25kDa. Immunoglobulin heavy chain (IgH) served as the loading control. Densitometric quantitation of the MUC1-N 400kDa band after a 2h Smk exposure was normalized to unexposed 0h control (designated as 1-fold) and reported as mean ± SEM fold changes (**p < 0.01). (B) Time-dependent shedding of the smoke-specific 400kDa MUC1-N isoform. Culture media of polarized HBE cells were collected at indicated times after Smk exposure. MUC1-N in Smk-exposed media was measured using a human CA15-3 ELISA kit. Results are presented as mU/ml using human CA15-3 standard provided in the kit. Shed MUC1-N was confirmed as the smoke-induced 400kDa band with VU4H5 IP followed by VU4H5 western blotting (WB) as shown in the left corner of the ELISA curve. IgH bands serve as the loading control. (C) The 400kDa isoform of MUC1-N was detected in smoker’s serum. VU4H5 IP followed by VU4H5 WB was used to look for the presence of MUC1-N in sera obtained from two smokers; one with a smoking history of 60 pack-years and the other with a history of 35 pack-years. Results were compared to two patients who never smoked. The 400kDa isoform of MUC1-N was noted in the serum of the patient with a smoking history of 60 pack-years. Non-specific bands (NS) serve as the loading control. (D–E) HBE cells exposed to Smk were harvested at indicated time points, IP’d with anti-MUC1-C and probed with VU4H5, anti-MUC1-C, biotinylated wheat germ agglutinin (WGA; N-acetylglucosamine (GlcNAc) and sialic acid moieties) and biotinylated vicia villosa lectin (VVA; N-acetylgalactosamine (GalNAc)) on MUC1-N and MUC1-C. Equal loading was confirmed by IgH bands. Densitometric quantitation of the glycosylated 400kDa MUC1-N (D) and glycosylated MUC1-C (E) detected by WGA after a 2h or 1h Smk exposure was normalized to unexposed 0h control (designated as 1-fold) (mean ± SEM fold change; **p < 0.01).
Figure 2
Figure 2
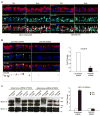
Smoke-induced MUC1-C/p120ctn interaction depends on MUC1 glycosylation in polarized HBE cells. (A) HBE cells exposed to smoke (Smk) were harvested at indicated time points, IP’d using anti-MUC1-C and probed with VU4H5, anti-p120ctn and anti-MUC1-C. IgH bands served as the loading control. Densitometric quantitation of 400kDa MUC1-N and MUC1-C bound p120ctn in Smk-treated cells was normalized to untreated Ctrl (designated 0h as 1-fold) and reported as mean ± SEM fold changes. **p < 0.01, Smk-treated cells versus Ctrl. (B–C) HBE cells were stained by immunofluorescence after exposure to Smk and smoke-free medium (Ctrl) for 4h. (B) Immunostaining with anti-MUC1-C (red, top panels) and anti-p120ctn (green, middle panels) is shown. White boxes in middle panels indicate p120ctn at intercellular areas, which remains intact in Ctrl cells but predominantly lost in Smk-exposed cells. Merged MUC1-C and p120ctn images (generating yellow signals, bottom panels) demonstrate colocalization of MUC1-C and p120ctn in the cytoplasm and basolateral membranes (white arrowheads) after smoke exposure. (C) Staining with anti-MUC1-N (red, top panels) and anti-Tn (anti-GalNAc, green, middle panels). Glycosylated MUC1-N (MUC1-N-Tn, bottom panels) is indicated by overlaying of MUC1-N and Tn images generating yellow signals (yellow arrowheads). Cell nuclei were visualized with DAPI (blue). Scale bar represents 50μm. (D) HBE cells were preincubated with TB [20ug/ml tunicamycin (N-glycosylation inhibitor) and 2mM benzyl-α-GalNAc (O-glycosylation inhibitor)] or vehicle control (DMSO) overnight and exposed to Smk and Ctrl medium for 4h in the presence of TB. MUC1-C IP was analyzed with MUC1-N, MUC1-C and p120ctn antibodies. After TB treatment, anti-MUC1-N recognized the 150kDa and 230kDa isoforms of MUC1-N, while anti-MUC1-C recognized MUC1-C bands between 20kDa and 22kDa. Equal loading was confirmed with IgH. Densitometric quantitation of p120ctn IP’d by MUC1-C in Smk and/or TB-treated cells was normalized to untreated Ctrl (designated as 1-fold) and reported as mean ± SEM fold change. **p < 0.01, Smk and/or TB-treated cells versus untreated Ctrl.
Figure 3
Figure 3
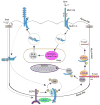
Smoke-induced MUC1-C glycosylation modulates MUC1-C tyrosine phosphorylation (TyrP) in polarized HBE cells. (A–B) HBE cells were preincubated with TB or vehicle control (DMSO) overnight before treating with Smk or Ctrl medium for 4h in the presence of TB. (A) Cell lysates were analyzed by WB probed with TyrP (PY100 or PY20) antibodies. Blots were stripped and reprobed with MUC1-C antibody. Bands recognized by PY100 and PY20 overlapped with each other and with MUC1-C. Equal loading was confirmed with GAPDH. Densitometric quantitation of MUC1-C-TyrP (PY100) and MUC1-C-TyrP (PY20) after Smk and/or TB treatment was normalized to untreated Ctrl (designed as 1-fold) and reported as mean ± SEM. **p < 0.01, Smk and/or TB-treated cells versus untreated Ctrl. (B) Immunostaining with anti-MUC1-C (red, top panels), anti-PY100 (green, middle panels of left two lanes) or anti-PY20 (green, middle panels of right two lanes). Merged MUC1-C and PY100/PY20 images (generating yellow signals, bottom panels) demonstrate smoke-provoked MUC1-C-TyrP (yellow arrowheads). Cell nuclei were visualized with DAPI (blue). Scale bar represents 50μm.
Figure 4
Figure 4
Smoke provoked formation of MUC1-C/galectin-3/EGFR complexes in polarized HBE cells. (A) HBE cells were treated with Ctrl or Smk medium at 23 (25%), 46 (50%) and 92 (100%) mg/m3 total suspension particles (TSP) for 4h. MUC1-C IP was analyzed by WB probed with galectin-3, EGFR and MUC1-C antibodies. Blots were stripped and reprobed with TyrP antibodies (4G10, PY20 and PY100). Bands recognized by 4G10 overlapped with EGFR (175kDa) and MUC1-C (20-25kDa) bands. Bands recognized by PY20 (20-25kDa) and PY100 (20-25kDa) overlapped with each other and with MUC1-C. Equal loading was confirmed with IgH bands. Quantitation of galectin-3, EGFR, EGFR-TyrP (4G10), MUC1-C-TyrP (4G10) and MUC1-C-TyrP (PY100) pulled down by MUC1-C after 100% Smk exposure was normalized to untreated control (designated as 1-fold) and reported as mean ± SEM fold change. **p < 0.01, Smk-treated cells versus untreated Ctrl. (B) HBE cells were treated with Ctrl or 100% Smk medium for 4h and immunostained with antibodies directed against MUC1-C (red, top panels), galectin-3 (green, middle panels of left two lanes) or EGFR (green, middle panels of right two lanes). Merged MUC1-C/galectin-3 signal (yellow, bottom panels of left two lanes) indicates smoke-induced MUC1-C/galectin-3 interaction (yellow arrowheads). Merged MUC1-C/EGFR signal (yellow, bottom panels of right two lanes) demonstrates smoke-induced formation of MUC1-C/EGFR complexes (yellow arrowheads). Cell nuclei were stained with DAPI (blue). Scale bar represents 50μm.
Figure 5
Figure 5
Smoke-induced MUC1-C glycosylation modulates MUC1-C/galectin-3/EGFR complex formation and Src/Jnk/MUC1-C signaling downstream of EGFR in polarized HBE cells. (A–B) HBE cells were preincubated with TB or vehicle control (DMSO) overnight before treating with Smk or Ctrl medium for 4h in the presence of TB. (A) MUC1-C IP was analyzed with WB probed with galectin-3, EGFR, TyrP (4G10), Src and MUC1-C antibodies. The 175kDa bands recognized by 4G10 completely overlapped with EGFR. Equal loading was confirmed with IgH bands. Quantitation of MUC1-C bound galectin-3, EGFR, EGFR-TyrP and Src after smoke and/or TB exposure was normalized to untreated control (designated as 1-fold) and reported as mean ± SEM fold change. (B) WB probed with TyrP (4G10), Tyr416-phosphorylated Src (Src-P), Thr183/Tyr185-phosphorylated SAPK/Jnk (Jnk-P) and MUC1-C antibodies. The 175kDa bands recognized by 4G10 completely overlapped with EGFR. Equal loading was confirmed with GAPDH. Densitometric quantitation of EGFR-TyrP, Src-P and Jnk-P after smoke and/or TB treatment was normalized to untreated control (designated as 1-fold) and graphed as mean ± SEM fold change. **p < 0.01, Smk-treated cells versus untreated Ctrl.
Figure 6
Figure 6
Adenovirus-delivered shRNA knockdown of GALNT6 in polarized HBE cells. (A) GALNT6 colocalized with MUC1-N and Golgi marker 58K. HBE cells were treated with Ctrl or Smk medium for 4h and immunostained with antibodies against MUC1-N (red, top panels of left two lanes), 58K (red, top panels of right two lanes), GALNT6 (green, middle panels). Merged MUC1-N/GALNT6 images (yellow signals, bottom panels of left two lanes) indicate MUC1-N colocalized with GALNT6 (yellow arrowheads) before and after smoke treatment. Merged 58K/GALNT6 images (yellow signals, bottom panels of right two lanes) demonstrate localization of GALNT6 in Golgi before and after smoke exposure (yellow arrowheads). Cell nuclei were stained with DAPI (blue). Scale bar represents 50μm. (B) Pseudostratified HBE cells were infected with 1*MOI (multiplicity of infectivity) adenovirus-delivered scrambled shRNA or GALNT6 shRNA overnight, followed by 4 days in culture. Immunostaining of MUC1-N (red, top row), GALNT6 (green, 2nd row), and merged MUC1-N/GALNT6 (yellow, 3rd row) indicate colocalization. Nuclei were visualized with DAPI (blue). Scar bar represents 50μm. Monochrome images of GALNT6 were inverted to black signals (red circles, bottom panels) and quantitated with ImageJ software. Knocking down GALNT6 in GALNT6 shRNA-treated cells was compared to scrambled shRNA-treated control (designated as 1-fold) and graphed as mean ± SEM fold change. **p < 0.01, GALNT6 shRNA-treated cells versus scrambled shRNA control. (C) Polarized HBE cells were infected with 1*MOI or 2*MOI of adenovirus-delivered scrambled shRNA or GALNT6 shRNA overnight and cultured for another 4 days. Cells treated with Smk or Ctrl medium for 4h were IP’d with MUC1-C and probed with MUC1-N and MUC1-C antibodies. Densitometric quantitation of the 400kDa MUC1-N band (mean ± SEM, **p < 0.01) compared to scrambled shRNA/Ctrl exposed cells (designated as 1-fold),
Figure 7
Figure 7
Suppression of smoke-induced MUC1-N glycosylation abolished smoke-provoked MUC1-C/p120ctn interaction and E-cad loss in polarized HBE cells. (A–B) Polarized HBE cells were infected with 1*MOI of adenoviral scrambled shRNA or GALNT shRNA overnight and cultured for another 4 days before exposing to Ctrl or Smk medium for 4h. (A) The cell lysates were IP’d with anti-MUC1-C followed by WB probed with p120ctn, E-cad, β-ctn and MUC1-C antibodies. Equal loading was confirmed with IgH bands. Densitometric quantitation (mean ± SEM fold change, **p < 0.01) of MUC1-bound p120ctn (black columns) and E-cad (gray columns). (B) Immunofluorescent staining of polarized HBE cells exposed to scrambled shRNA/Ctrl, scrambled shRNA/Smk, GALNT6 shRNA/Ctrl and GALNT6 shRNA/Smk for p120ctn (green, top panels), β-ctn (green, middle panels), E-cad (lower panels) and MUC1-C (red, all panels), DAPI nuclear counterstain (blue). Scale bar represents 50μm.
Figure 8
Figure 8
Schematic representation of smoke-provoked MUC1 glycosylation in regulation of MUC1-C/p120ctn interaction and adherens junction (AJ) disruption. MUC1 is localized on the apical plasma membrane (PM) of polarized HBE cells as a MUC1-N/MUC1-C heterodimer where it is spatially segregated from AJs and EGFR on the basolateral PM. Cigarette smoke (Smk) stimulates internalization of MUC1 and its intracellular trafficking to the Golgi, where MUC1 is initially O-glycosylated (O-Gly) by GALNT6 and further N- (N-Gly) and O-glycosylated by other enzymes. In response to smoke, fully glycosylated MUC1 is sent back to apical PM and subsequently translocated to basolateral PM, where MUC1-C, EGFR and galectin-3 form a signalosome through the bridging of their sugar moieties following smoke-induced shedding of MUC1-N. Src is also recruited to the MUC1-C/EGFR/galectin-3 complex by smoke where it binds the cytoplasmic tail of MUC1-C (MUC1-CT). Smoke destroys tight junctions (TJs) and gains access to basolateral EGFR through increased paracellular permeability. MUC1-C is then activated through tyrosine phosphorylation (Y-P) by smoke-induced EGFR/Src/Jnk signaling. Activation of MUC1-C promotes its interaction with p120ctn and β-ctn at AJs. MUC1-C/p120ctn interaction exposes ubiquitin ligation sites of E-cad and thereby results in proteasomal degradation of E-cad, a hallmark of EMT [12]. MUC1-C/β-ctn interaction facilitates β-ctn’s entry into nucleus and activates the Wnt signaling pathway leading to cell proliferation and migration [11]. Blocking smoke-induced MUC1 glycosylation through GALNT6 knock down prevents the loss of Ecad and restores AJ integrity. Thus, targeting the initiating O-glycosylation step of MUC1 may provide a novel therapeutic approach to prevent smoke-induced EMT and early lung carcinogenesis.

Similar articles

Cited by

References

    1. Society AC. Cancer Facts & Figures 2009. 2009 Internet http://wwwcancerorg/acs/groups/content/@nho/documents/document/500809web....
    1. Gilpin EA, Pierce JP. Demographic differences in patterns in the incidence of smoking cessation: United States 1950–1990. Ann Epidemiol. 2002;12:141–150. - PubMed
    1. Polyak K, Weinberg RA. Transitions between epithelial and mesenchymal states: acquisition of malignant and stem cell traits. Nat Rev Cancer. 2009;9:265–273. - PubMed
    1. Mani SA, Guo W, Liao MJ, et al. The epithelial-mesenchymal transition generates cells with properties of stem cells. Cell. 2008;133:704–715. - PMC - PubMed
    1. Thoreson MA, Reynolds AB. Altered expression of the catenin p120 in human cancer: implications for tumor progression. Differentiation. 2002;70:583–589. - PubMed

Publication types

MeSH terms