Clinical validation of KRAS, BRAF, and EGFR mutation detection using next-generation sequencing
- PMID: 24838331
- PMCID: PMC4332779
- DOI: 10.1309/AJCPMWGWGO34EGOD
Clinical validation of KRAS, BRAF, and EGFR mutation detection using next-generation sequencing
Abstract
Objectives: To validate next-generation sequencing (NGS) technology for clinical diagnosis and to determine appropriate read depth.
Methods: We validated the KRAS, BRAF, and EGFR genes within the Ion AmpliSeq Cancer Hotspot Panel using the Ion Torrent Personal Genome Machine (Life Technologies, Carlsbad, CA).
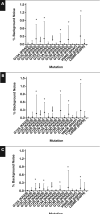
Results: We developed a statistical model to determine the read depth needed for a given percent tumor cellularity and number of functional genomes. Bottlenecking can result from too few input genomes. By using 16 formalin-fixed, paraffin-embedded (FFPE) cancer-free specimens and 118 cancer specimens with known mutation status, we validated the six traditional analytic performance characteristics recommended by the Next-Generation Sequencing: Standardization of Clinical Testing Working Group. Baseline noise is consistent with spontaneous and FFPE-induced C:G→T:A deamination mutations.
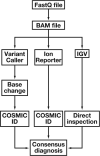
Conclusions: Redundant bioinformatic pipelines are essential, since a single analysis pipeline gave false-negative and false-positive results. NGS is sufficiently robust for the clinical detection of gene mutations, with attention to potential artifacts.
Keywords: BRAF; Deamination; EGFR; KRAS; Next-generation sequencing; Read depth; Validation.
Copyright© by the American Society for Clinical Pathology.
Figures


References
-
- Mullis K, Faloona F, Scharf S, et al. Specific enzymatic amplification of DNA in vitro: the polymerase chain reaction. Cold Spring Harb Symp Quant Biol. 1986;51(pt 1):263–273. - PubMed
-
- Mullis KB. The unusual origin of the polymerase chain reaction. Sci Am. 1990;262:56–61, 64-65. - PubMed
-
- Moore GE. Cramming more components onto integrated circuits. Electronics. 1965;38:114–117.
-
- Rothberg JM, Hinz W, Rearick TM, et al. An integrated semiconductor device enabling non-optical genome sequencing. Nature. 2011;475:348–352. - PubMed
Publication types
MeSH terms
Substances
Grants and funding
LinkOut - more resources
Full Text Sources
Other Literature Sources
Research Materials
Miscellaneous

