

Force-induced melting of DNA--evidence for peeling and internal melting from force spectra on short synthetic duplex sequences
- PMID: 24838568
- PMCID: PMC4081069
- DOI: 10.1093/nar/gku441
Force-induced melting of DNA--evidence for peeling and internal melting from force spectra on short synthetic duplex sequences
Abstract
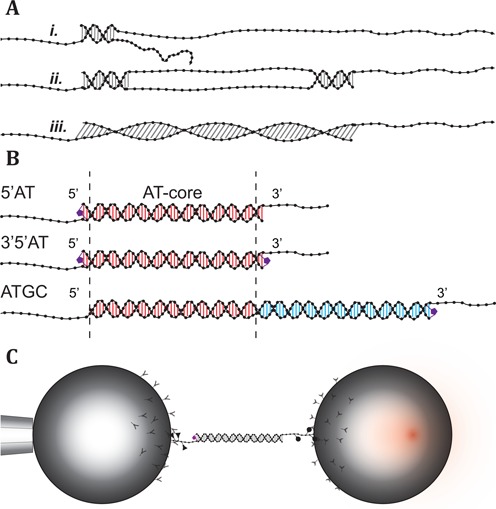
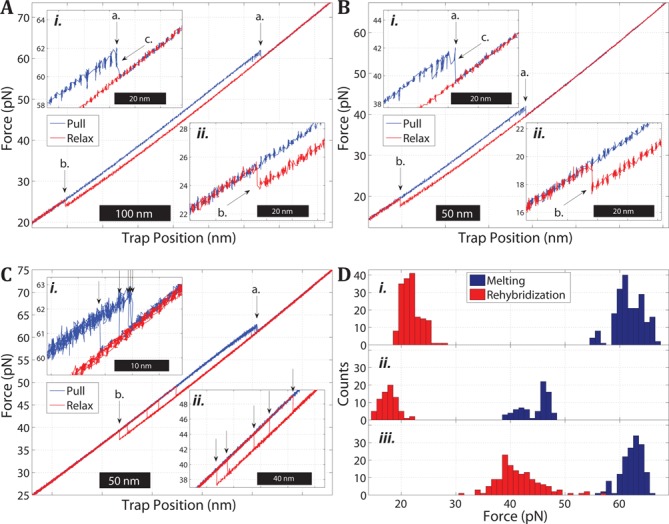
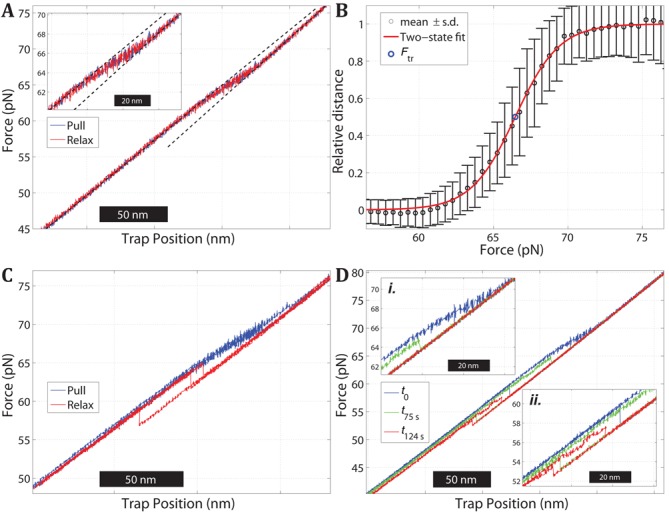
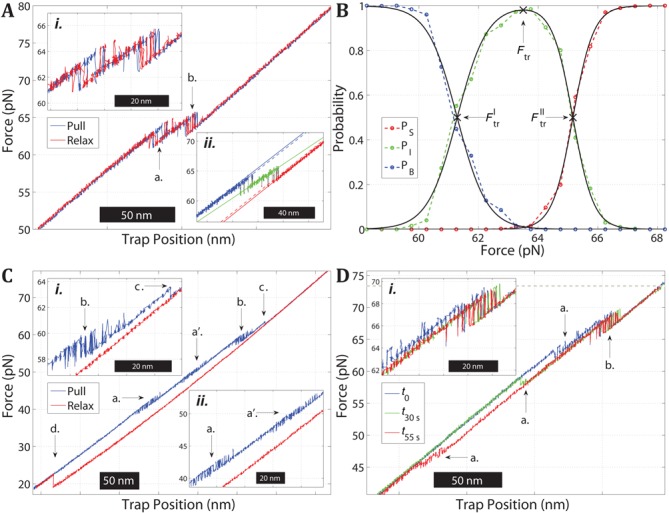
Overstretching of DNA occurs at about 60-70 pN when a torsionally unconstrained double-stranded DNA molecule is stretched by its ends. During the transition, the contour length increases by up to 70% without complete strand dissociation. Three mechanisms are thought to be involved: force-induced melting into single-stranded DNA where either one or both strands carry the tension, or a B-to-S transition into a longer, still base-paired conformation. We stretch sequence-designed oligonucleotides in an effort to isolate the three processes, focusing on force-induced melting. By introducing site-specific inter-strand cross-links in one or both ends of a 64 bp AT-rich duplex we could repeatedly follow the two melting processes at 5 mM and 1 M monovalent salt. We find that when one end is sealed the AT-rich sequence undergoes peeling exhibiting hysteresis at low and high salt. When both ends are sealed the AT sequence instead undergoes internal melting. Thirdly, the peeling melting is studied in a composite oligonucleotide where the same AT-rich sequence is concatenated to a GC-rich sequence known to undergo a B-to-S transition rather than melting. The construct then first melts in the AT-rich part followed at higher forces by a B-to-S transition in the GC-part, indicating that DNA overstretching modes are additive.
© The Author(s) 2014. Published by Oxford University Press on behalf of Nucleic Acids Research.
Figures
Similar articles
-
Revealing the competition between peeled ssDNA, melting bubbles, and S-DNA during DNA overstretching by single-molecule calorimetry.Proc Natl Acad Sci U S A. 2013 Mar 5;110(10):3865-70. doi: 10.1073/pnas.1213740110. Epub 2013 Feb 19. Proc Natl Acad Sci U S A. 2013. PMID: 23431154 Free PMC article.
-
Nanomechanics of Diaminopurine-Substituted DNA.Biophys J. 2019 Mar 5;116(5):760-771. doi: 10.1016/j.bpj.2019.01.027. Epub 2019 Feb 1. Biophys J. 2019. PMID: 30795872 Free PMC article.
-
Effect of pH on the overstretching transition of double-stranded DNA: evidence of force-induced DNA melting.Biophys J. 2001 Feb;80(2):874-81. doi: 10.1016/S0006-3495(01)76066-3. Biophys J. 2001. PMID: 11159454 Free PMC article.
-
Revealing the competition between peeled ssDNA, melting bubbles, and S-DNA during DNA overstretching using fluorescence microscopy.Proc Natl Acad Sci U S A. 2013 Mar 5;110(10):3859-64. doi: 10.1073/pnas.1213676110. Epub 2013 Feb 19. Proc Natl Acad Sci U S A. 2013. PMID: 23431161 Free PMC article.
-
Periodic Melting of Oligonucleotides by Oscillating Salt Concentrations Triggered by Microscale Water Cycles Inside Heated Rock Pores.Angew Chem Int Ed Engl. 2019 Sep 9;58(37):13155-13160. doi: 10.1002/anie.201907909. Epub 2019 Aug 7. Angew Chem Int Ed Engl. 2019. PMID: 31322800 Free PMC article. Review.
Cited by
-
Mechanisms of small molecule-DNA interactions probed by single-molecule force spectroscopy.Nucleic Acids Res. 2016 May 19;44(9):3971-88. doi: 10.1093/nar/gkw237. Epub 2016 Apr 16. Nucleic Acids Res. 2016. PMID: 27085806 Free PMC article.
-
Optical Trapping Nanometry of Hypermethylated CPG-Island DNA.Biophys J. 2017 Feb 7;112(3):512-522. doi: 10.1016/j.bpj.2016.12.029. Epub 2017 Jan 18. Biophys J. 2017. PMID: 28109529 Free PMC article.
-
The role of the C-domain of bacteriophage T4 gene 32 protein in ssDNA binding and dsDNA helix-destabilization: Kinetic, single-molecule, and cross-linking studies.PLoS One. 2018 Apr 10;13(4):e0194357. doi: 10.1371/journal.pone.0194357. eCollection 2018. PLoS One. 2018. PMID: 29634784 Free PMC article.
-
TMPyP binding evokes a complex, tunable nanomechanical response in DNA.Nucleic Acids Res. 2024 Aug 12;52(14):8399-8418. doi: 10.1093/nar/gkae560. Nucleic Acids Res. 2024. PMID: 38943349 Free PMC article.
-
Single-molecule mechanochemical characterization of E. coli pol III core catalytic activity.Protein Sci. 2017 Jul;26(7):1413-1426. doi: 10.1002/pro.3152. Epub 2017 Mar 16. Protein Sci. 2017. PMID: 28263430 Free PMC article.
References
-
- Chen Z., Yang H., Pavletich N.P. Mechanism of homologous recombination from the RecA-ssDNA/dsDNA structures. Nature. 2008;453:489–494. - PubMed
-
- Dame R.T., Noom M.C., Wuite G.J.L. Bacterial chromatin organization by H-NS protein unravelled using dual DNA manipulation. Nature. 2006;444:387–390. - PubMed
-
- Smith S.B., Finzi L., Bustamante C. Direct mechanical measurements of the elasticity of single DNA molecules by using magnetic beads. Science. 1992;258:1122–1126. - PubMed
-
- Cluzel P., Lebrun A., Heller C., Lavery R., Viovy J.-L., Chatenay D., Caron F. DNA: an extensible molecule. Science. 1996;271:792–794. - PubMed
Publication types
MeSH terms
Substances
Grants and funding
LinkOut - more resources
Full Text Sources
Other Literature Sources
Miscellaneous
