

doi: 10.1007/978-1-4939-0554-6_12.
Identification of mutations in laboratory-evolved microbes from next-generation sequencing data using breseq
Affiliations
- PMID: 24838886
- PMCID: PMC4239701
- DOI: 10.1007/978-1-4939-0554-6_12
Item in Clipboard
Identification of mutations in laboratory-evolved microbes from next-generation sequencing data using breseq
Methods Mol Biol.
2014.
Abstract
Next-generation DNA sequencing (NGS) can be used to reconstruct eco-evolutionary population dynamics and to identify the genetic basis of adaptation in laboratory evolution experiments. Here, we describe how to run the open-source breseq computational pipeline to identify and annotate genetic differences found in whole-genome and whole-population NGS data from haploid microbes where a high-quality reference genome is available. These methods can also be used to analyze mutants isolated in genetic screens and to detect unintended mutations that may occur during strain construction and genome editing.
Figures
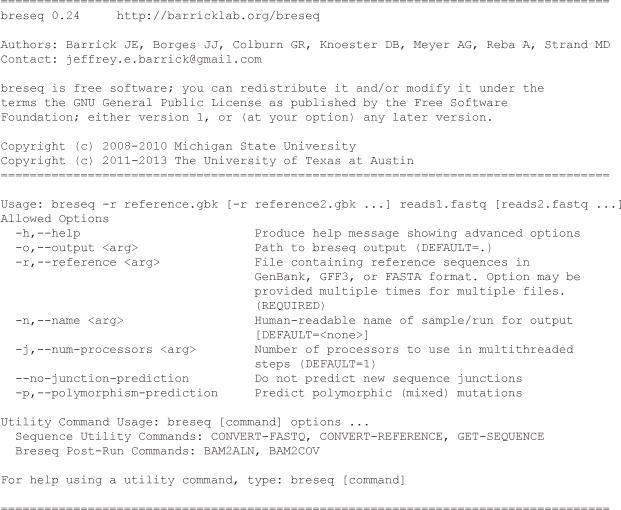
Basic breseq command line help.
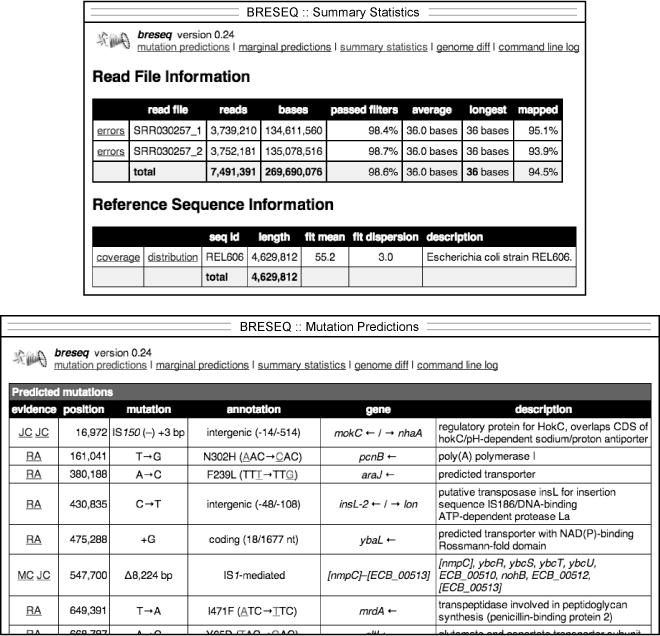
Example of breseq output. The upper panel shows a portion of the
summary.html file which displays general information about the read data sets, reference sequence, and run parameters. The lower panel shows part of the main
index.html page reporting predicted mutations.
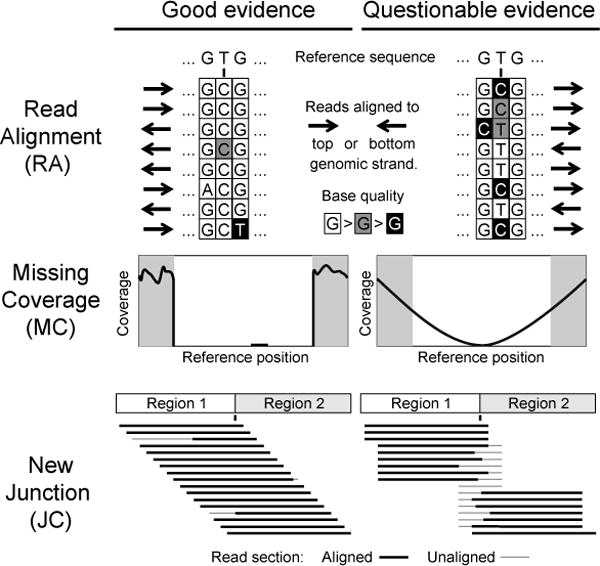
Evaluating evidence supporting predicted mutations. Characteristics of high-quality (left column) and low-quality (right column) evidence items that you may encounter in breseq output are shown as discussed in the text.
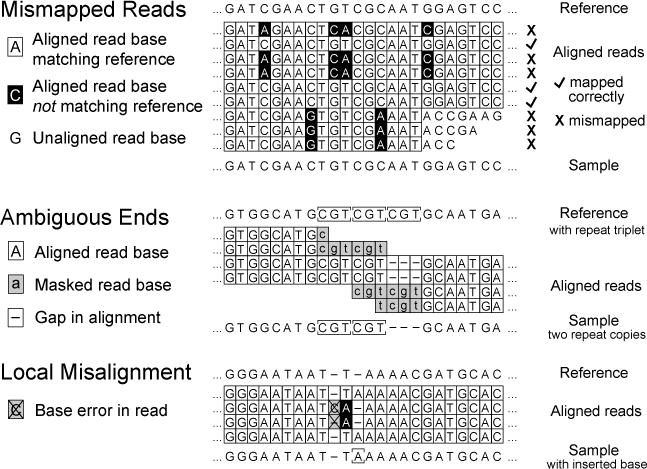
Possible causes of spurious or low-quality read alignment (RA) evidence. As described in the text, mismapping of reads to an incorrect reference genome site or local misalignment of bases in correctly mapped reads containing base errors can degrade accuracy and sensitivity when predicting micro-indels and single nucleotide variants.
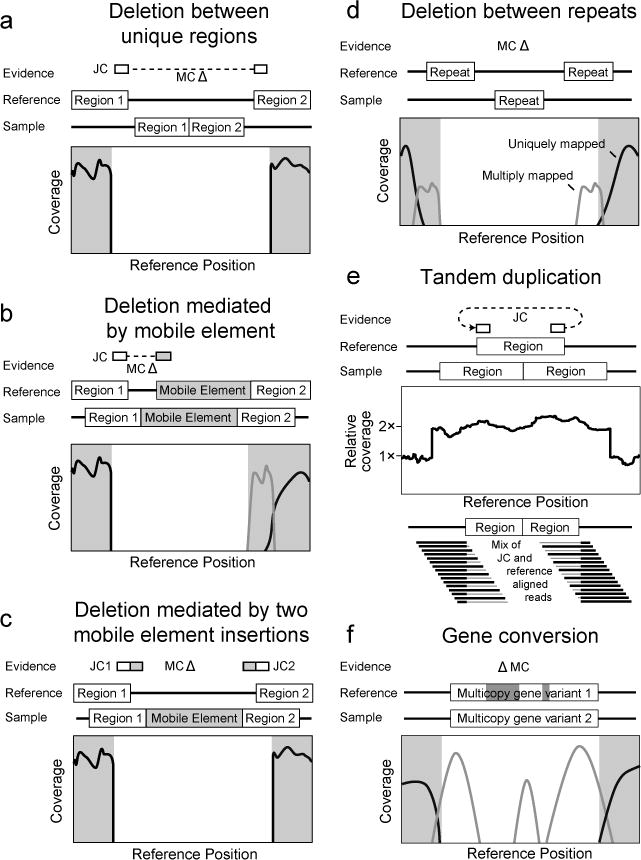
Evidence supporting complex mutations. In each case schematics of the reference genome and the genome of a sequenced clone are shown. Evidence items that would support the genetic difference between the two genomes are shown above. Relevant graphs of read-depth coverage or read alignments are shown below. See the discussion in the text for more details.
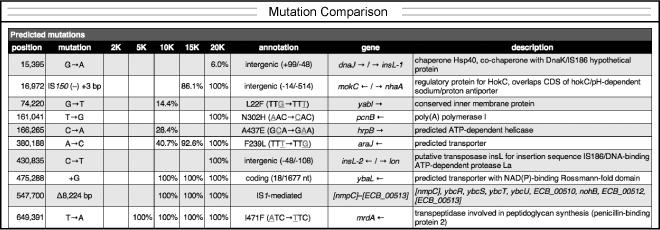
Example time course of mutation frequencies in an evolving population. A portion of the comparison file generated from the results of analyzing several whole-population samples is shown. Each column (e.g. 2K) is for a sample from a different time point (e.g., 2000 generations).
References
Publication types
MeSH terms
Grants and funding
LinkOut - more resources
Full Text Sources
Other Literature Sources
