Effect of chronic ethanol exposure on rat ventilatory responses to hypoxia and hypercapnia
- PMID: 24838903
- PMCID: PMC4012235
- DOI: 10.6061/clinics/2014(05)11
Effect of chronic ethanol exposure on rat ventilatory responses to hypoxia and hypercapnia
Abstract
Objective: The effect of chronic ethanol exposure on chemoreflexes has not been extensively studied in experimental animals. Therefore, this study tested the hypothesis that known ethanol-induced autonomic, neuroendocrine and cardiovascular changes coincide with increased chemoreflex sensitivity, as indicated by increased ventilatory responses to hypoxia and hypercapnia.
Methods: Male Wistar rats were subjected to increasing ethanol concentrations in their drinking water (first week: 5% v/v, second week: 10% v/v, third and fourth weeks: 20% v/v). At the end of each week of ethanol exposure, ventilatory parameters were measured under basal conditions and in response to hypoxia (evaluation of peripheral chemoreflex sensitivity) and hypercapnia (evaluation of central chemoreflex sensitivity).
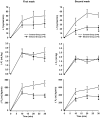
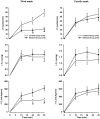
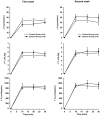
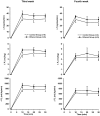
Results: Decreased respiratory frequency was observed in rats exposed to ethanol from the first until the fourth week, whereas minute ventilation remained unchanged. Moreover, we observed an increased tidal volume in the second through the fourth week of exposure. The minute ventilation responses to hypoxia were attenuated in the first through the third week but remained unchanged during the last week. The respiratory frequency responses to hypoxia in ethanol-exposed rats were attenuated in the second through the third week but remained unchanged in the first and fourth weeks. There was no significant change in tidal volume responses to hypoxia. With regard to hypercapnic responses, no significant changes in ventilatory parameters were observed.
Conclusions: Our data are consistent with the notion that chronic ethanol exposure does not increase peripheral or central chemoreflex sensitivity.
Conflict of interest statement
No potential conflict of interest was reported.
Figures


Similar articles
-
Hypercapnic vs. hypoxic control of cardiovascular, cardiovagal, and sympathetic function.Am J Physiol Regul Integr Comp Physiol. 2009 Feb;296(2):R402-10. doi: 10.1152/ajpregu.90772.2008. Epub 2008 Dec 17. Am J Physiol Regul Integr Comp Physiol. 2009. PMID: 19091913
-
Peripheral chemoreflex contribution to ventilatory long-term facilitation induced by acute intermittent hypercapnic hypoxia in males and females.J Physiol. 2020 Oct;598(20):4713-4730. doi: 10.1113/JP280458. Epub 2020 Aug 19. J Physiol. 2020. PMID: 32744340
-
Simultaneous assessment of central and peripheral chemoreflex regulation of muscle sympathetic nerve activity and ventilation in healthy young men.J Physiol. 2019 Jul;597(13):3281-3296. doi: 10.1113/JP277691. Epub 2019 May 28. J Physiol. 2019. PMID: 31087324
-
Ventilatory responses to hypercapnia and hypoxia following chronic hypercapnia in the rat.Respir Physiol. 2000 Aug;122(1):35-43. doi: 10.1016/s0034-5687(00)00134-1. Respir Physiol. 2000. PMID: 10936599
-
Chemoreflexes--physiology and clinical implications.Acta Physiol Scand. 2003 Mar;177(3):377-84. doi: 10.1046/j.1365-201X.2003.01083.x. Acta Physiol Scand. 2003. PMID: 12609009 Review.
Cited by
-
Ventrolateral periaqueductal gray matter integrative system of defense and antinociception.Pflugers Arch. 2022 Apr;474(4):469-480. doi: 10.1007/s00424-022-02672-0. Epub 2022 Feb 24. Pflugers Arch. 2022. PMID: 35201425 Free PMC article.
References
-
- Resstel LB, Tirapelli CR, Lanchote VL, Uyemura AS, De Oliveira AM, Corrêa FM. Chronic ethanol consumption alters cardiovascular functions in conscious rats. Life Sci. 2006;78(19):2179–87. - PubMed
-
- Resstel LB, Scopinho AA, Lopes da Silva A, Antunes-Rodrigues J, Corrêa FM. Increased circulating vasopressin may account for ethanol-induced hypertension in rats. Am J Hypertens. 2008;21(8):930–5. - PubMed
-
- Abdel-Rahman AA, Wooles WR. Ethanol induced hypertension involves impairment of baroreceptors. Hypertension. 1987;10(1):1965–73. - PubMed
-
- Chan TC, Sutter MC. Ethanol consumption and blood pressure. Life Sci. 1983;33(20):1965–73. - PubMed
Publication types
MeSH terms
Substances
LinkOut - more resources
Full Text Sources
Other Literature Sources

