. 2014 Nov;70(2):785-94.
doi: 10.1007/s12013-014-9982-8.

Laurdan monitors different lipids content in eukaryotic membrane during embryonic neural development

Affiliations

Laurdan monitors different lipids content in eukaryotic membrane during embryonic neural development

Gabriele Bonaventura et al. Cell Biochem Biophys. 2014 Nov.

Abstract

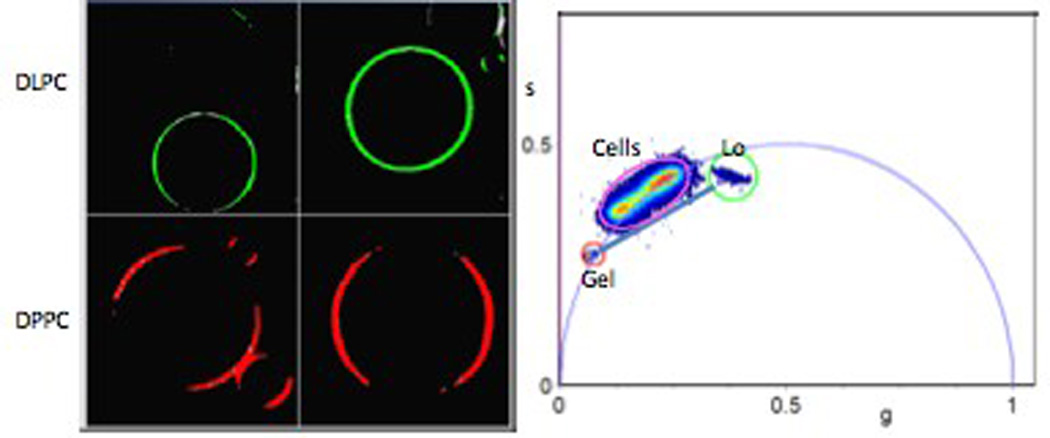
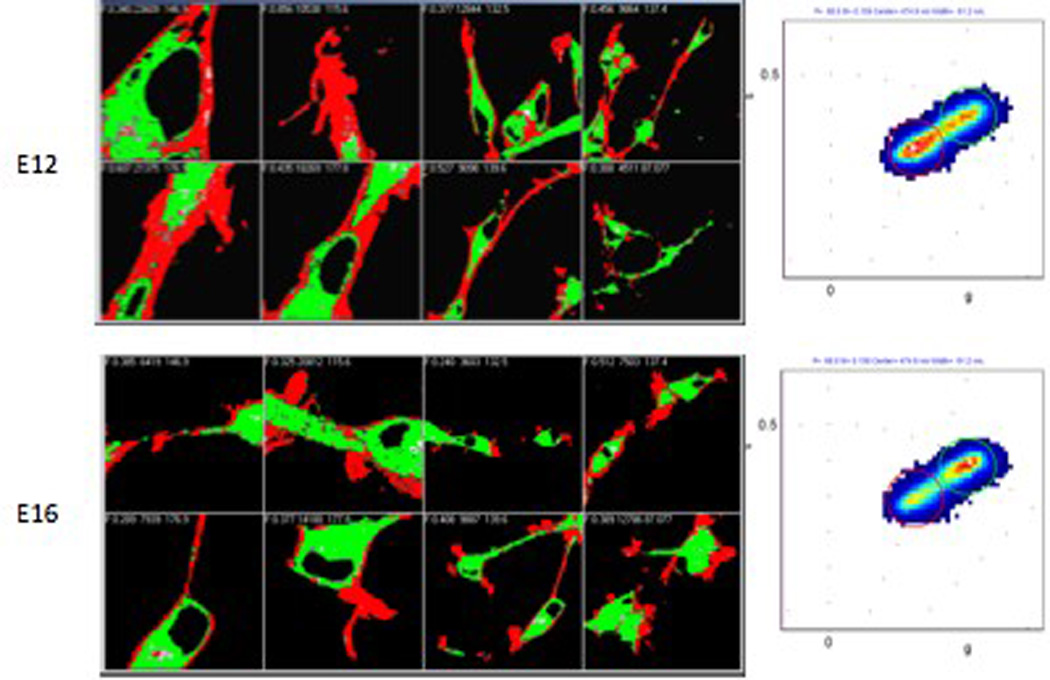
We describe a method based on fluorescence-lifetime imaging microscopy (FLIM) to assess the fluidity of various membranes in neuronal cells at different stages of development [day 12 (E12) and day 16 (E16) of gestation]. For the FLIM measurements, we use the Laurdan probe which is commonly used to assess membrane water penetration in model and in biological membranes using spectral information. Using the FLIM approach, we build a fluidity scale based on calibration with model systems of different lipid compositions. In neuronal cells, we found a marked difference in fluidity between the internal membranes and the plasma membrane, being the plasma membrane the less fluid. However, we found no significant differences between the two cell groups, E12 and E16. Comparison with NIH3T3 cells shows that the plasma membranes of E12 and E16 cells are significantly more fluid than the plasma membrane of the cancer cells.


Figures

Figure 1
Figure 1
Schematic of the phasor transformation. Decay curves with different single exponential lifetimes map in different position in the phasor plot with points on the universal circle. The faster is the exponential decay, the more the point is to the right.
Figure 2
Figure 2
Linear combination property of phasors. A) The combination in one pixel of two single exponentials gives a phasor value on the line joining the phasors corresponding to the two exponentials. B) If in one pixel (the size of the PSF, about 300nm) there are Laurdan molecules with different environments, although each environment is decaying as a complex exponential, they will combine linearly to give an experimental points in the line joining the phasors of the two different environments.
Figure 3
Figure 3
Empirical sensitivity scale for Laurdan in two extreme phase, gel and liquid crystalline. The red cursor marks the position of the gel phase as found in the DPPC GUVs at room temperature and the green cursor corresponds to the phasor position of DLPC at room temperature, which is in the liquid disordered phase. Note that the cells values (E12 and E16 cells) are not on the linear combination line of these two extreme values but they lay on or close to the universal circle indicating that the cell membrane is quite different that the pure phospholipid phases.
Figure 4
Figure 4
Phasor analysis of E12 and E16 cells (Channel 1). The compound phasor plot for each group (E12 and E16) is shown at right. For this analysis the position of the red and green cursor selectors was not changed. For each cell, the number of pixels in the red and green cursor was recorded. The results of the average number of pixels and the significance of the observed difference is shown in Table 1.
Figure 5
Figure 5
Phasor analysis of NIH3T3 cells. The positions of the red and green cursor selectors are the same as in figure 1. The statistics of the pixels in each of the cursors is shown in table 1. The fraction of green colored pixels is larger for the group of (N=20) NIH3T3 cells than for the neuronal cells.
Figure 6
Figure 6
Selection of pixels with prevalent distribution in the plasma membrane. The red cursor selection in figure 1 was subdivided in two parts using the pink and green cursor. The green cursor in figure 1 was substituted with a black cursor, effectively painting in black all pixels of high fluidity. The statistical analysis of the pixels painted with the two different colors show no significant difference between the two groups of cells (E12 and E16). The white arrows indicate some regions along the plasma membrane of apparent different fluidity.

Similar articles

Cited by

References

    1. Los DA, Mironov KS, Allakhverdiev SI. Regulatory role of membrane fluidity in gene expression and physiological functions. Photosynths Re. 2013 - PubMed
    1. Wiśniewska A, Draus J, Subczynski WK. Is a fluid-mosaic model of biological membranes fully relevant? Studies on lipid organization in model and biological membranes. Cell Mol Biol Lett. 2003;8(1):147–159. - PubMed
    1. Wang TY, Silvius JR. Sphingolipid partitioning into ordered domains in cholesterol-free and cholesterol-containing lipid bilayers. Biophys. J. 2003;84(1):367–378. - PMC - PubMed
    1. Lin C, Wang LH, Fan TY, Kuo FW. Lipid content and composition during the oocyte development of two gorgonian coral species in relation to low temperature preservation. PLoS One. 2012;7(7):e38689. - PMC - PubMed
    1. Marguet D, Lenne PF, Rigneault H, He HT. Dynamics in the plasma membrane: how to combine fluidity and order. EMBO J. 2006;25(15):3446–3457. - PMC - PubMed

Publication types