. 2014 Aug;128(2):291-303.
doi: 10.1007/s00401-014-1291-1. Epub 2014 May 20.

CNS-PNETs with C19MC amplification and/or LIN28 expression comprise a distinct histogenetic diagnostic and therapeutic entity

Affiliations

CNS-PNETs with C19MC amplification and/or LIN28 expression comprise a distinct histogenetic diagnostic and therapeutic entity

Tara Spence et al. Acta Neuropathol. 2014 Aug.

Abstract

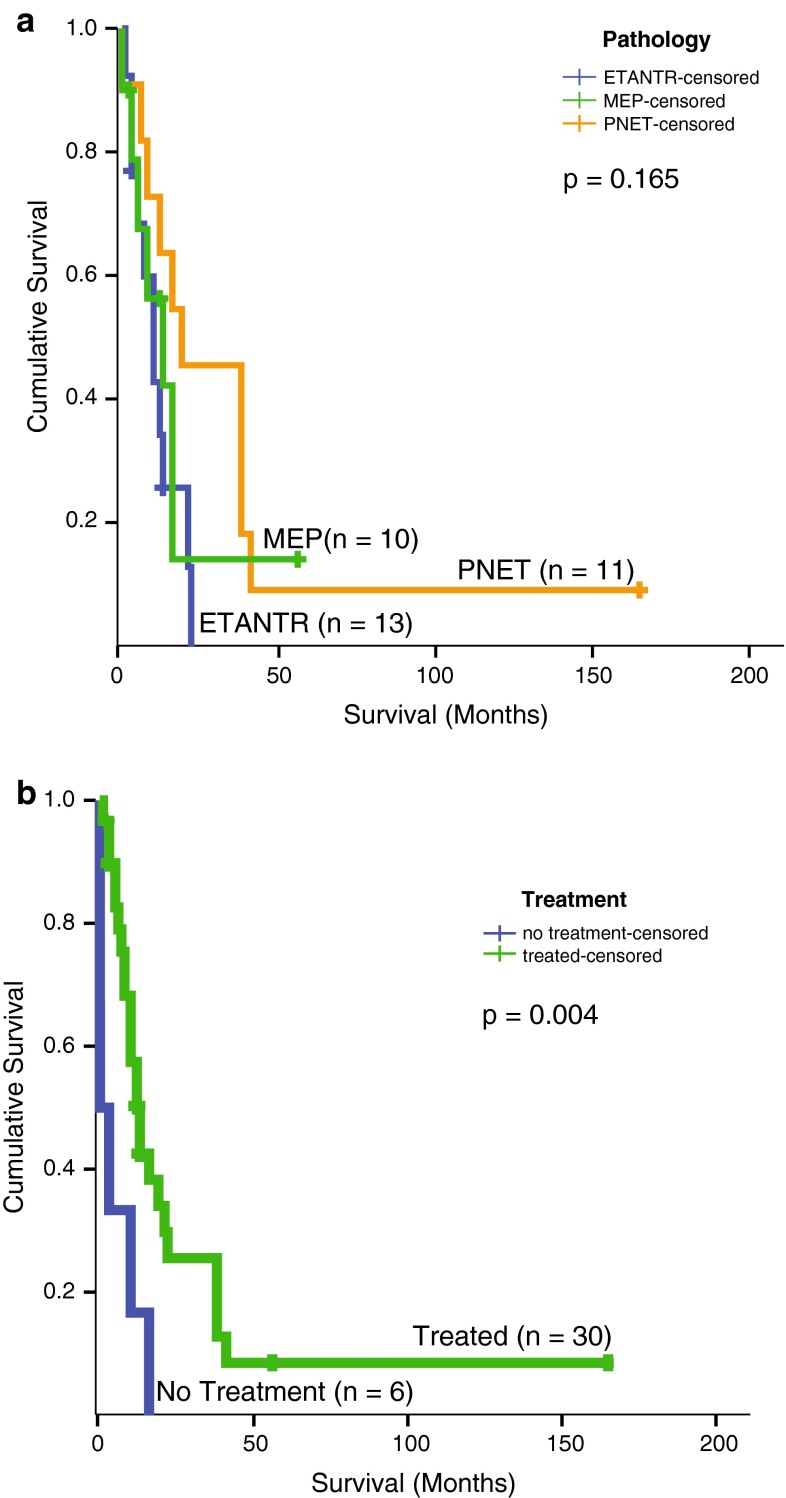
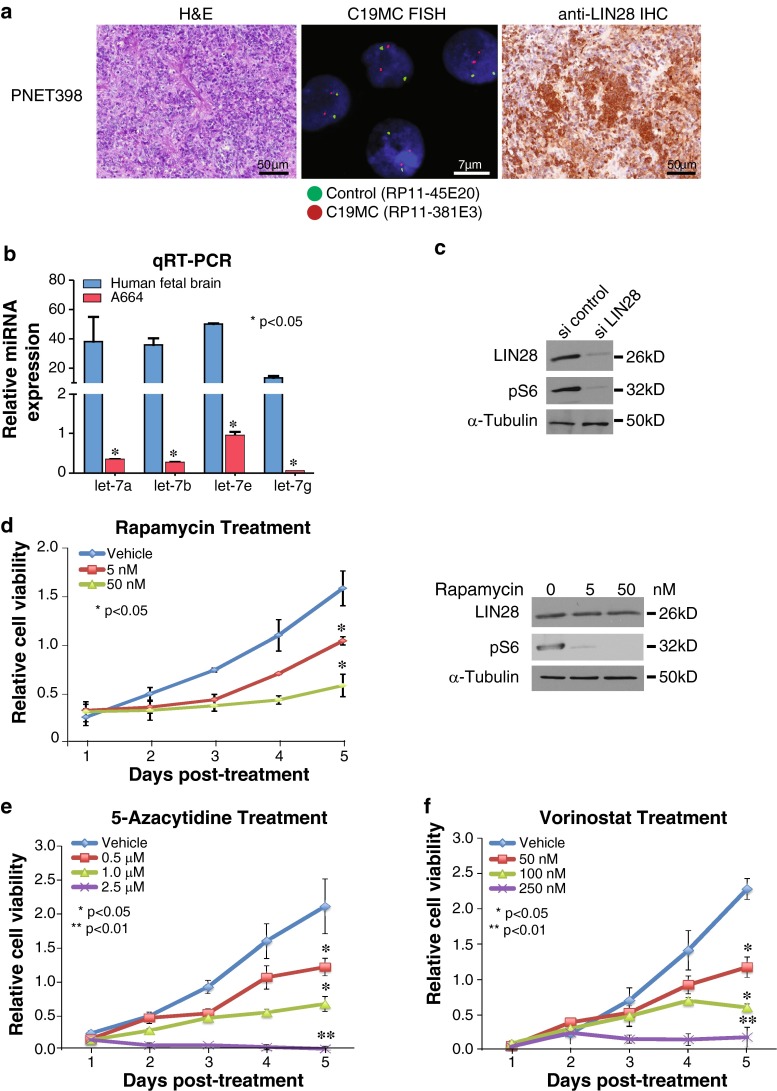
Amplification of the C19MC oncogenic miRNA cluster and high LIN28 expression has been linked to a distinctly aggressive group of cerebral CNS-PNETs (group 1 CNS-PNETs) arising in young children. In this study, we sought to evaluate the diagnostic specificity of C19MC and LIN28, and the clinical and biological spectra of C19MC amplified and/or LIN28+ CNS-PNETs. We interrogated 450 pediatric brain tumors using FISH and IHC analyses and demonstrate that C19MC alteration is restricted to a sub-group of CNS-PNETs with high LIN28 expression; however, LIN28 immunopositivity was not exclusive to CNS-PNETs but was also detected in a proportion of other malignant pediatric brain tumors including rhabdoid brain tumors and malignant gliomas. C19MC amplified/LIN28+ group 1 CNS-PNETs arose predominantly in children <4 years old; a majority arose in the cerebrum but 24 % (13/54) of tumors had extra-cerebral origins. Notably, group 1 CNS-PNETs encompassed several histologic classes including embryonal tumor with abundant neuropil and true rosettes (ETANTR), medulloepithelioma, ependymoblastoma and CNS-PNETs with variable differentiation. Strikingly, gene expression and methylation profiling analyses revealed a common molecular signature enriched for primitive neural features, high LIN28/LIN28B and DNMT3B expression for all group 1 CNS-PNETs regardless of location or tumor histology. Our collective findings suggest that current known histologic categories of CNS-PNETs which include ETANTRs, medulloepitheliomas, ependymoblastomas in various CNS locations, comprise a common molecular and diagnostic entity and identify inhibitors of the LIN28/let7/PI3K/mTOR axis and DNMT3B as promising therapeutics for this distinct histogenetic entity.


Figures

Fig. 1
Fig. 1
Histologic spectra of CNS-PNETs with C19MC amplification and LIN28 immunopositivity. Representative H and E stains, C19MC FISH and LIN28 IHC analyses of CNS-PNETs with histologic features of ETANTR (PNET67), MEP (PNET255), CNS-PNET with divergent differentiation (PNET3) and undifferentiated PNET-NOS (PNET161)
Fig. 2
Fig. 2
Survival analyses of C19MC amplified and/or LIN28+ CNS-PNETs. a Log-rank survival analysis stratified by histologic classes of CNS-PNETs; log-rank test comparing overall survival of ETANTR vs MEP vs PNET is shown. b Log-rank comparison of overall survival for all CNS-PNETs stratified by receipt of treatment versus no treatment
Fig. 3
Fig. 3
Unified gene expression and methylation signatures for C19MC amplified and/or LIN28 + CNS-PNETs. a, b Unsupervised hierarchical cluster analysis was performed on gene expression (a) and methylation data (b) generated, respectively, from 59 (Illumina HT-12v4 arrays) and 45 (Illumina human 450 k arrays) primary CNS-PNETs. Most stable tumor cluster patterns were achieved with a minimal set of 300 genes, and across 500–4000 methylation probes (Supplemental Fig. 2) and indicated distinct segregation of C19MC amplified/LIN8+ tumors from Groups 2/3 CNS-PNETs, which lack either feature. Anatomic location of individual tumors, specific CNS-PNET histology and C19MC genomic status are indicated. c Quantitative RT-PCR analyses of C19MC miRNAs: miR-512-3p, 517a, 517c, 519a, 520g, in a subset of CNS-PNETs without C19MC genomic amplification is shown relative to that of C19MC amplified tumors, RNU6B served as control. d Genes most highly enriched in group 1 versus group 2/3 CNS-PNETs were identified using a supervised t test adjusted for multiple hypothesis testing (false discovery rate ≤0.05). Heat map shows relative magnitude of enrichment for specific genes with functions in cell lineage, signaling and epigenomic regulation at a significance of *q ≤ 0.05. Tumor analyzed by qRT-PCR in c are underlined, non-C19MC amplified tumors and the C19MC amplified control tumor analyzed are, respectively, shown in bold
Fig. 4
Fig. 4
Expression of mTOR target, phospho-S6 and DNA methyl transferase, DNMT3B, in group 1 CNS-PNETs. Representative a phospho-S6 and b nuclear DNMT3B immunostain patterns in LIN28+ C19MC amplified (PNET 109, 111, 138, 378, 402) and non-amplified primary group 1 CNS-PNETs (PNET394 and 398)
Fig. 5
Fig. 5
Treatment of group 1 CNS-PNET cells with rapamycin, 5-azacytidine and vorinostat. A stable cell line from a primary non-C19MC amplified/LIN28+ CNS-PNET was established and tested for sensitivity to inhibitors of mTOR signaling and epigenomic modifiers as described in methods. a H and E stains, C19MC FISH and LIN28 IHC analysis of primary PNET398 from which the A664 cell line was derived, indicating lack of C19MC amplification and strong LIN28 immunopositivity. bc Quantitative RT-PCR and Western blot analyses indicating an intact LIN28-let7/mTOR axis in A664 cells. Expression of let-7a, 7b, 7e and 7g miRNAs was determined relative to that in normal human 16-week-old fetal brain and normalized to RNU6B. Results are shown as mean ± SEM; n = 2. A664 cells were treated with scrambled, control siRNA and siRNA directed against LIN28 and examined for expression of LIN28 and pS6 with α-tubulin as loading control. df A664 cells were treated with varying doses of rapamycin, 5-azacytidine and vorinostat, and drug effect on cell viability was measured using MTS assays. Plots represent summary of three independent experiments with three replicas/data point; error bars represent SEM. *p ≤ 0.05. Right panel in figure d shows Western blot analyses for LIN28 and pS6 expression in rapamycin-treated A664 cells; tubulin served as loading control

Comment in

Similar articles

Cited by

References

    1. Adamek D, Sofowora KD, Cwiklinska M, Herman-Sucharska I, Kwiatkowski S. Embryonal tumor with abundant neuropil and true rosettes: an autopsy case-based update and review of the literature. Childs Nerv Syst. 2013;29:849–854. doi: 10.1007/s00381-013-2037-4. - DOI - PMC - PubMed
    1. Buccoliero AM, Castiglione F, Rossi Degl’Innocenti D, et al. Embryonal tumor with abundant neuropil and true rosettes: morphological, immunohistochemical, ultrastructural and molecular study of a case showing features of medulloepithelioma and areas of mesenchymal and epithelial differentiation. Neuropathology. 2010;30:84–91. doi: 10.1111/j.1440-1789.2009.01040.x. - DOI - PubMed
    1. Deisch J, Raisanen J, Rakheja D. Immunohistochemical expression of embryonic stem cell markers in malignant rhabdoid tumors. Pediatr Dev Pathol. 2011;14:353–359. doi: 10.2350/10-09-0902-OA.1. - DOI - PubMed
    1. Eberhart CG, Brat DJ, Cohen KJ, Burger PC. Pediatric neuroblastic brain tumors containing abundant neuropil and true rosettes. Pediatr Dev Pathol. 2000;3:346–352. doi: 10.1007/s100249910049. - DOI - PubMed
    1. Gessi M, Giangaspero F, Lauriola L, et al. Embryonal tumors with abundant neuropil and true rosettes: a distinctive CNS primitive neuroectodermal tumor. Am J Surg Pathol. 2009;33:211–217. doi: 10.1097/PAS.0b013e318186235b. - DOI - PMC - PubMed

Publication types

MeSH terms