. 2014 May 19;9(5):e97326.
doi: 10.1371/journal.pone.0097326. eCollection 2014.

PHEX mimetic (SPR4-peptide) corrects and improves HYP and wild type mice energy-metabolism

Affiliations

PHEX mimetic (SPR4-peptide) corrects and improves HYP and wild type mice energy-metabolism

Lesya V Zelenchuk et al. PLoS One. .

Erratum in

  • PLoS One. 2014;9(6):e101192

Abstract

Context: PHEX or DMP1 mutations cause hypophosphatemic-rickets and altered energy metabolism. PHEX binds to DMP1-ASARM-motif to form a complex with α5β3 integrin that suppresses FGF23 expression. ASARM-peptides increase FGF23 by disrupting the PHEX-DMP1-Integrin complex. We used a 4.2 kDa peptide (SPR4) that binds to ASARM-peptide/motif to study the DMP1-PHEX interaction and to assess SPR4 for the treatment of energy metabolism defects in HYP and potentially other bone-mineral disorders.

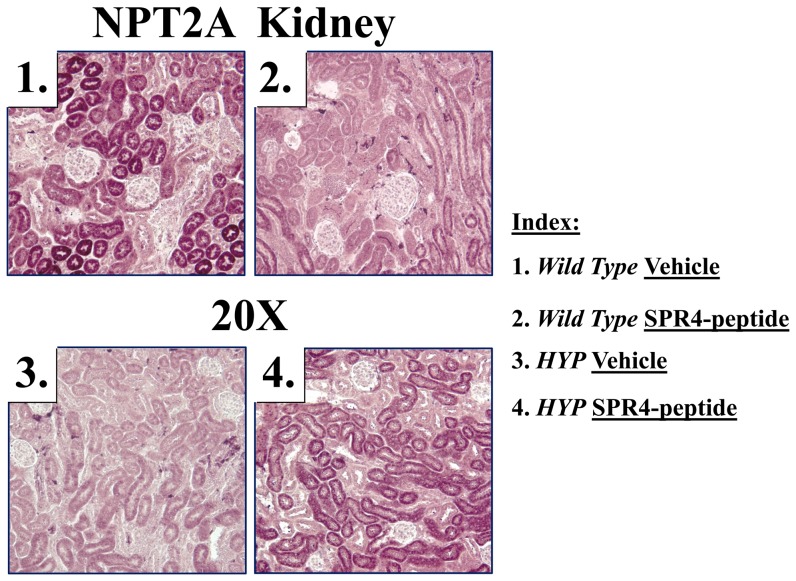
Design: Subcutaneously transplanted osmotic pumps were used to infuse SPR4-peptide or vehicle (VE) into wild-type mice (WT) and HYP-mice (PHEX mutation) for 4 weeks.

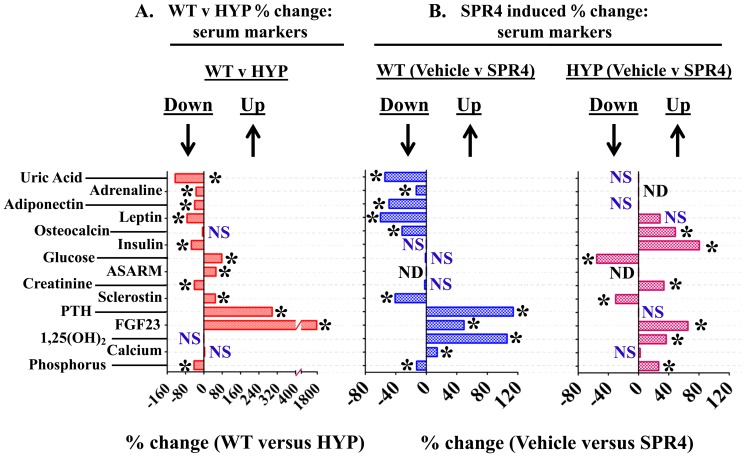
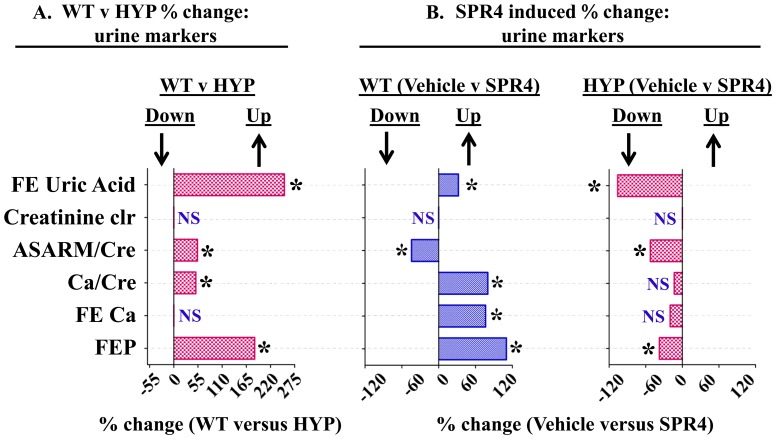
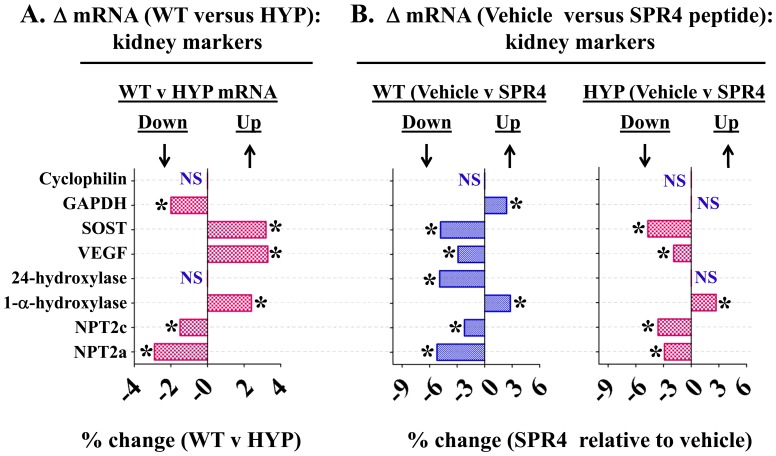
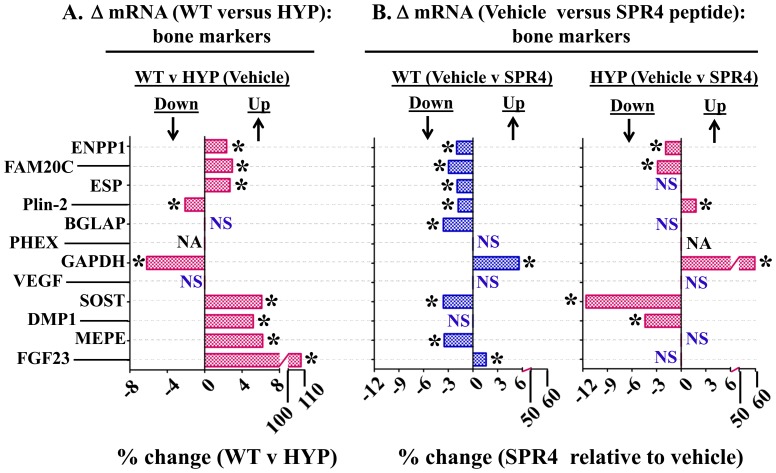
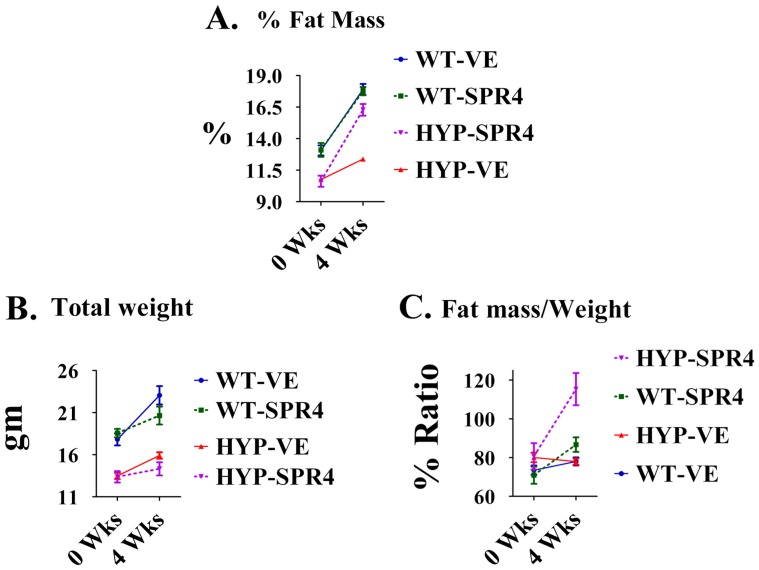
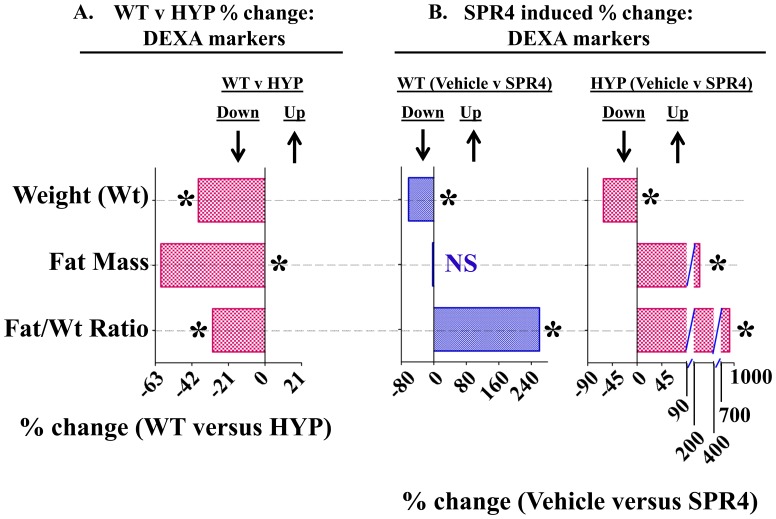
Results: SPR4 partially corrected HYP mice hypophosphatemia and increased serum 1.25(OH)2D3. Serum FGF23 remained high and PTH was unaffected. WT-SPR4 mice developed hypophosphatemia and hypercalcemia with increased PTH, FGF23 and 1.25(OH)2D3. SPR4 increased GAPDH HYP-bone expression 60× and corrected HYP-mice hyperglycemia and hypoinsulinemia. HYP-VE serum uric-acid (UA) levels were reduced and SPR4 infusion suppressed UA levels in WT-mice but not HYP-mice. SPR4 altered leptin, adiponectin, and sympathetic-tone and increased the fat mass/weight ratio for HYP and WT mice. Expression of perlipin-2 a gene involved in obesity was reduced in HYP-VE and WT-SPR4 mice but increased in HYP-SPR4 mice. Also, increased expression of two genes that inhibit insulin-signaling, ENPP1 and ESP, occurred with HYP-VE mice. In contrast, SPR4 reduced expression of both ENPP1 and ESP in WT mice and suppressed ENPP1 in HYP mice. Increased expression of FAM20C and sclerostin occurred with HYP-VE mice. SPR4 suppressed expression of FAM20C and sclerostin in HYP and WT mice.

Conclusions: ASARM peptides and motifs are physiological substrates for PHEX and modulate osteocyte PHEX-DMP1-α5β3-integrin interactions and thereby FGF23 expression. These interactions also provide a nexus that regulates bone and energy metabolism. SPR4 suppression of sclerostin and/or sequestration of ASARM-peptides improves energy metabolism and may have utility for treating familial rickets, osteoporosis, obesity and diabetes.


Conflict of interest statement

Competing Interests: Peter Rowe is the inventor on a patent that is associated with the peptide SPR4, “Polypeptides for Bone Mineralization, Pub No.: US 2008/0076717 A1”. This does not alter the authors' adherence to PLOS ONE policies on sharing data and materials.

Figures

Figure 1
Figure 1. Percentage difference serum chemistry comparisons between wild type (WT) and HYP mice and mice infused with vehicle or SPR4-peptide.
For absolute measurements in tabulated form see Table 1 . Mice were sacrificed on day 28 and sera prepared from 16 hour fasted mice housed in metabolic cages. Values are means of percentage difference and are significant (* = P<0.05) unless indicated by NS (unpaired t test, confidence interval  = 95%; see Table 2 for absolute numbers). Column headings represent: WT  =  wild type mice; HYP  =  X-linked hypophosphatemic rickets mice; SPR4  =  infused SPR4-peptide; Vehicle  =  Saline infused; NS  =  not significant; ND  =  not done; * = P<0.05. Histogram bars to the left of zero on the axis indicate down regulation and to the right up regulation.
Figure 2
Figure 2. Percentage difference urine chemistry comparisons between wild type (WT) and HYP mice and mice infused with vehicle or SPR4-peptide.
For absolute measurements in tabulated form see Table 2 . Mice were sacrificed on day 28 and urine collected from 16 hour fasted mice housed in metabolic cages. Values are means of percentage difference and are significant (* = P<0.05) unless indicated by NS (unpaired t test confidence, interval  = 95%; see also Table 3 for absolute numbers). Column headings represent; WT  =  wild type mice, HYP  =  X-linked hypophosphatemic rickets mice, SPR4  =  infused SPR4-peptide and Vehicle  =  Saline infused. Histogram bars to the left of zero on the axis indicate down regulation and to the right up regulation. Index : FE Uric Acid  =  percentage change fractional Excretion of uric acid; creatinine clearance  =  percentage change creatinine clearance; ASARM/Cre  =  percentage change in ASARM/creatinine; Ca/Cre  =  percentage change in calcium/creatinine ratio; Fe Ca  =  percentage change in the fractional excretion of calcium; FEP  =  percentage change in the fractional excretion of phosphate; NS  =  not significant; * = P<0.05. Histogram bars to the left of zero on the axis indicate down regulation and to the right up regulation.
Figure 3
Figure 3. Whole kidney gene expression (mRNA) comparisons as measured by quantitative RT/PCR (qRT-PCR) for wild type (WT) and HYP mice infused with vehicle or SPR4 peptide for 28 days.
Column headings represent; WT  =  wild type mice, HYP  =  X-linked hypophosphatemic rickets mice, SPR4  =  infused SPR4-peptide and Vehicle  =  Saline infused. For gene analysis mRNA was prepared from whole kidneys snap frozen in LN2 and homogenized. For qRT-PCR gene analysis fold differences in expression calculated by the Pfaffl method were statistically analyzed for significance using the One Sample t-test and the Wilcoxon Signed rank-test with theoretical means set to 1. Results are significant (* = p<0.05) unless indicated by NS (see also Table 3 for detailed statistics). ND =  Not done, NS  =  Not SignificantIndex: Cyclophilin  =  cyclophilin; GAPDH  =  Glyceraldehyde 3-phosphate dehydrogenase; SOST  =  Sclerostin; VEGF  =  Vascular Endothelial Growth factor; 24-Hydroxylase  = 1,25-hydroxyvitamin D3 24-hydroxylase (CYP24A1); 1-α-Hydroxylase  =  25-hydroxyvitamin D3 1-alpha-hydroxylase (CYP27B1); NPT2c  =  Sodium-dependent phosphate co-transporter (Slc34a3); NPT2a  =  Sodium-dependent phosphate co-transporter (Slc34a1); NS  =  not significant; * = P<0.05. Histogram bars to the left of zero on the axis indicate down regulation and to the right up regulation.
Figure 4
Figure 4. Bone (femur) gene expression (mRNA) comparisons as measured by quantitative RT/PCR (qRT-PCR) for wild type (WT) and HYP mice infused with vehicle or SPR4-peptide for 28 days.
Mice were sacrificed on day 28 and femurs collected for RNA purification as described in methods. Column headings represent; WT  =  wild type mice, HYP  =  X-linked hypophosphatemic rickets mice, SPR4  =  infused SPR4-peptide and Vehicle  =  Saline infused. For gene analysis mRNA was prepared from bone marrow stromal cell “depleted” femurs as detailed in methods. For qRT-PCR gene analysis fold differences in expression calculated by the Pfaffl method were statistically analyzed for significance using the One Sample t-test and the Wilcoxon Signed rank-test with theoretical means set to 1. Results are significant (* = p<0.05) unless indicated by NS (see also Table 4 for detailed statistics). Index : FAM20C  =  Family with sequence similarity 20, member C Kinase also known as DMP4; ENPP1  =  Ectonucleotide Pyrophosphatase Phosphodiesterase 1; ESP  =  Osteotesticular protein tyrosine (OST-PTP); Plin-2  =  Perlipin-2; phosphatase; Cyclophilin  =  peptidylprolyl isomerase A (cyclophilin A); BGLAP  =  Osteocalcin or Bone Gamma-Carboxyglutamate (gla) protein; PHEX  =  Phosphate-regulating gene with Homologies to Endopeptidases on the X chromosome; GAPDH  =  Glyceraldehyde 3-phosphate dehydrogenase; VEGF  =  Vascular Endothelial Growth factor; DMP1  =  Dentin Matrix Protein 1; SOST  =  Sclerostin; MEPE  =  Matrix Extracellular Phosphoglycoprotein with ASARM -motif; FGF23  =  Fibroblast Growth Factor 23; NS  =  not significant; NA  =  not applicable, PHEX mutated in HYP; * = P<0.05. Histogram bars to the left of zero on the axis indicate down regulation and to the right up regulation.
Figure 5
Figure 5. Immunohistochemistry of kidney sections confirm changes in protein expression for Na dependent phosphate co-transporter (NPT2A; Slc34a1).
NPT2a protein-expression (purple-stain) in renal cortex sections is markedly decreased in HYP mice (compare photos 1 and 3). SPR4 peptide suppresses NPT2a expression in WT mice (compare photos 1 and 2) but increases NPT2a expression in HYP mice (compare photos 3 and 4). Staining is localized to proximal convoluted tubules with little glomerular staining. Magnifications are 20× and are from representative sections (matched regions).
Figure 6
Figure 6. SPR4-peptide induces a dramatic increase in fat mass/weight in HYP and WT mice.
Dual Energy X-ray Absorptiometry (DEXA) measurements using a Lunar PIXImus system were carried out as described previously and discussed in methods . Measurements are shown for mice prior to pump implantation and after sacrifice 28 days later. The temporal percentage change measurements are shown in Figure 7 and Table 5. (A) Percentage Fat Mass (% FAT Mass). HYPVE %-Fat-Mass was significantly less than WTVE %-Fat-Mass at all time-points. SPR4 peptide treatment significantly increased time-dependent gain in %-Fat-Mass for HYP mice (HYPSPR4) but not WT mice (WTSPR4) relative to respective vehicle groups. Following 2-way ANOVA analysis, phenotypic variation (including SPR4-treatment) was highly significant accounting for 31.86% of the total variance (F = 46.72, DFn = 3, Dfd = 32 and P<0.0001). Also, time-changes were highly significant accounting for 53.69% of the total variance (F = 236.22, DFn = 1, Dfd = 32 and P<0.0001). The phenotype/time interaction was also significant accounting for 7.18% of the total variance (F = 10.52, DFn = 3, Dfd = 32 and P<0.0001). (B) Total Weight (gm). HYPVE-mice weight was significantly less than WTVE-mice weight at all time-points. SPR4 peptide treatment significantly decreased time-dependent gain in weight for both HYP mice (HYPSPR4) and WT mice (WTSPR4) relative to respective vehicle groups. Following 2-way ANOVA analysis, phenotypic variation (including SPR4-treatment) was highly significant accounting for 64.65% of the total variance (F = 40.6, DFn = 3, Dfd = 32 and P<0.0001). Also, time-changes were highly significant accounting for 13.64% of the total variance (F = 25.69, DFn = 1, Dfd = 32 and P<0.0001). The phenotype/time interaction was significant accounting for 4.73% of the total variance (F = 2.97, DFn = 3, Dfd = 32 and P = 0.0463). (C) Ratio of Fat mass/Weight (% Ratio). No significant differences in fat-mass/weight ratios were observed between groups at 0 weeks (baseline, prior to pump implantation). In contrast, SPR4 peptide treatment significantly increased time-dependent gain in fat-Mass/weight ratio for both HYP mice (HYP-SPR4) and WT mice (WTSPR4) relative to respective vehicle groups. The gain in HYP-SPR4 fat-Mass/weight ratio was more marked and significantly greater than the WT-SPR4 mice. Following 2-way ANOVA analysis, phenotypic variation (including SPR4-treatment) was highly significant accounting for 30.60% of the total variance (F = 9.86, DFn = 3, Dfd = 32 and P<0.0001). Also, time-changes were highly significant accounting for 17.14% of the total variance (F = 16.58, DFn = 1, Dfd = 32 and P = 0.0003). The phenotype/time interaction was significant accounting for 19.17% of the total variance (F = 6.18, DFn = 3, Dfd = 32 and P = 0.002). Index : WTVE =  wild type mice infused with vehicle (0.9% physiological saline); HYPVE  =  X-linked hypophosphatemic rickets mice infused with vehicle (0.9% physiological saline); WTSPR4  =  wild type mice infused SPR4-peptide; HYPSPR4  =  X-linked hypophosphatemic rickets mice infused SPR4-peptide.
Figure 7
Figure 7. Temporal changes in (Weight, fat mass and fat mass/weight ratio) as measured by Dual Energy X-ray Absorptiometry (DEXA) for wild type and HYP mice infused with vehicle or SPR4-peptide for 28 days (See Figure 6 for static changes).
The mean percentage change over the 28 days for each metric was calculated and the percentage differences between the groups plotted as a histogram (see also Table 5 ). Values are mean percentage differences and are significant (* = P<0.05) unless indicated by NS (unpaired t test confidence interval  = 95%). Column headings represent; WT  =  wild type mice, HYP  =  X-linked hypophosphatemic rickets mice, SPR4  =  infused SPR4-peptide and Vehicle  =  Saline infused. Histogram bars to the left of zero on the y-axis indicate down regulation and to the right up regulation. DEXA measurements using a Lunar PIXImus system were carried out as described previously and discussed in methods . Index : Weight (Wt)  =  percentage difference in weight change over 4 weeks; Fat-Mass  =  percentage difference in total fat-mass change over 4 weeks; Fat/Wt Ratio  =  percentage difference in total fat-mass/weight change over 4 weeks.

Similar articles

Cited by

References

    1. Yamaguchi T, Sugimoto T (2011) Bone metabolism and fracture risk in type 2 diabetes mellitus [Review]. Endocrine journal 58: 613–624. - PubMed
    1. Zhang L, Choi HJ, Estrada K, Leo PJ, Li J, et al. (2013) Multi-stage genome-wide association meta-analyses identified two new loci for bone mineral density. Hum Mol Genet [Epub ahead of print] PMID:24249740. - PMC - PubMed
    1. Hsu YH, Kiel DP (2012) Clinical review: Genome-wide association studies of skeletal phenotypes: what we have learned and where we are headed. J Clin Endocrinol Metab 97: E1958–1977. - PMC - PubMed
    1. Zmuda JM, Yerges-Armstrong LM, Moffett SP, Klei L, Kammerer CM, et al. (2011) Genetic analysis of vertebral trabecular bone density and cross-sectional area in older men. Osteoporosis international 22: 1079–1090. - PMC - PubMed
    1. Jemtland R, Holden M, Reppe S, Olstad OK, Reinholt FP, et al. (2011) Molecular disease map of bone characterizing the postmenopausal osteoporosis phenotype. Journal of bone and mineral research 26: 1793–1801. - PubMed

Publication types

MeSH terms

Substances