. 2014 May 19;9(5):e97572.
doi: 10.1371/journal.pone.0097572. eCollection 2014.

A causal relation between bioluminescence and oxygen to quantify the cell niche

Affiliations

A causal relation between bioluminescence and oxygen to quantify the cell niche

Dennis Lambrechts et al. PLoS One. .

Erratum in

Abstract

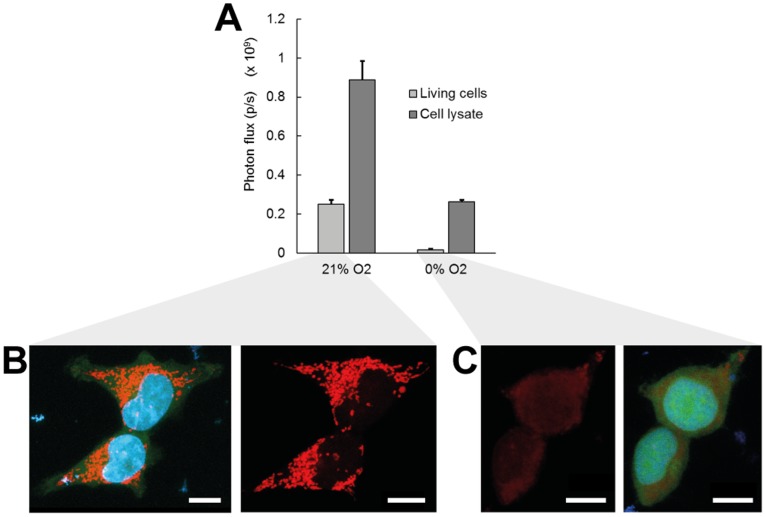
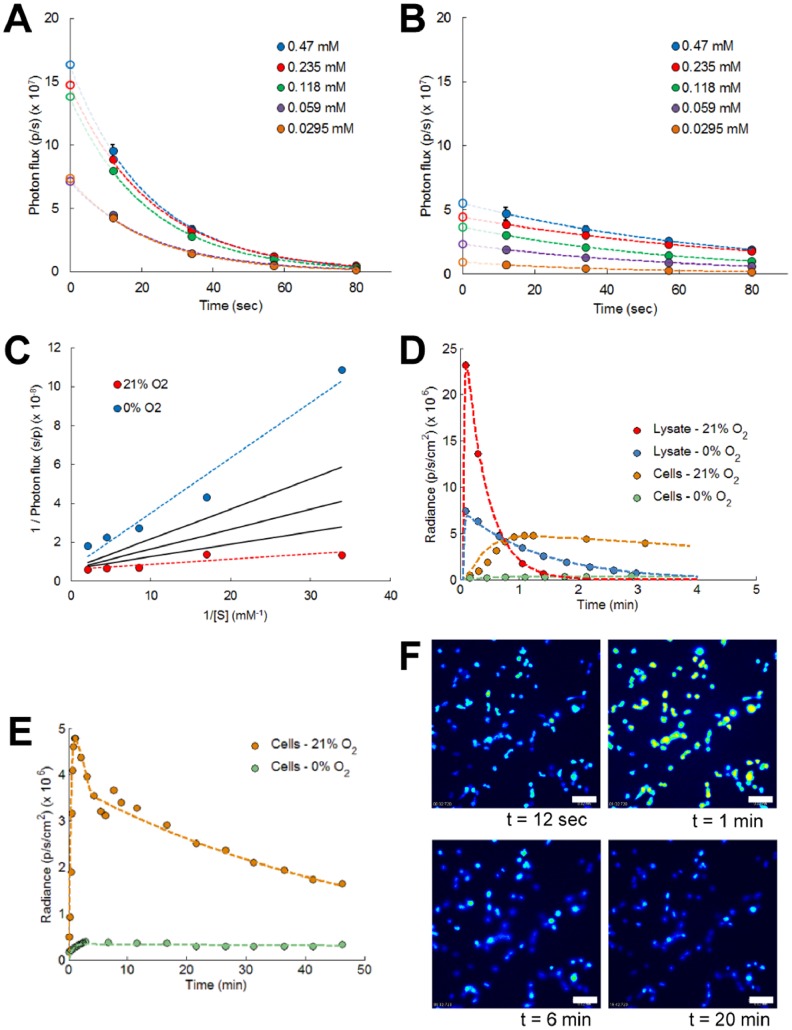
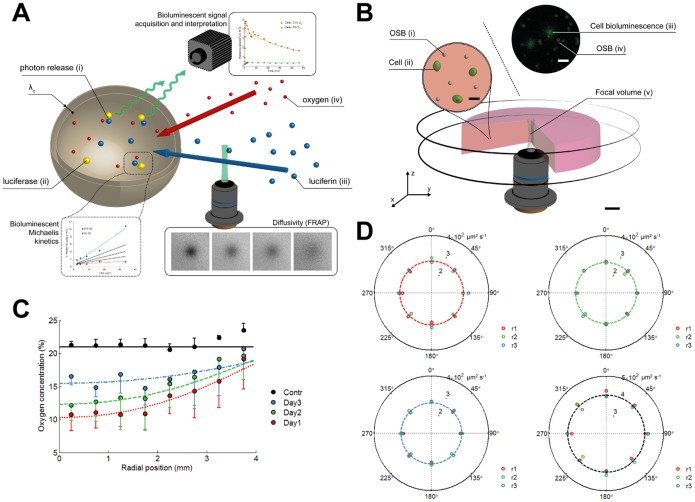
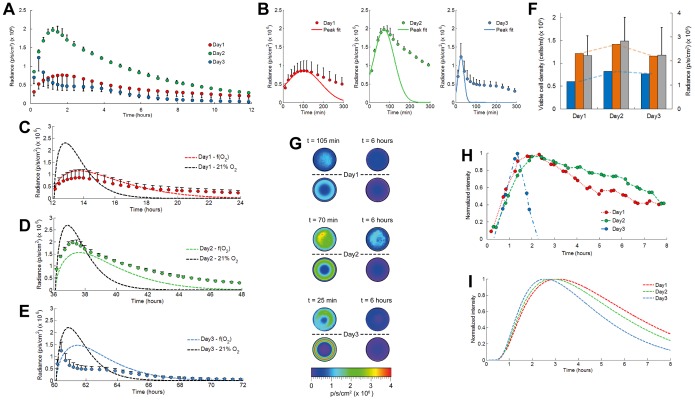
Bioluminescence imaging assays have become a widely integrated technique to quantify effectiveness of cell-based therapies by monitoring fate and survival of transplanted cells. To date these assays are still largely qualitative and often erroneous due to the complexity and dynamics of local micro-environments (niches) in which the cells reside. Here, we report, using a combined experimental and computational approach, on oxygen that besides being a critical niche component responsible for cellular energy metabolism and cell-fate commitment, also serves a primary role in regulating bioluminescent light kinetics. We demonstrate the potential of an oxygen dependent Michaelis-Menten relation in quantifying intrinsic bioluminescence intensities by resolving cell-associated oxygen gradients from bioluminescent light that is emitted from three-dimensional (3D) cell-seeded hydrogels. Furthermore, the experimental and computational data indicate a strong causal relation of oxygen concentration with emitted bioluminescence intensities. Altogether our approach demonstrates the importance of oxygen to evolve towards quantitative bioluminescence and holds great potential for future microscale measurement of oxygen tension in an easily accessible manner.


Conflict of interest statement

Competing Interests: Dennis Lambrechts is a scholar supported by the agency for Innovation by Science and Technology (IWT-Vlaanderen, project number 090727) via the IWT Baekeland program in which TiGenix NV acts as industrial partner. The purpose of the Baekeland program is to offer researchers the opportunity to carry out PhD research in close collaboration with the industrial sector. The Baekeland program provides support for individual mandates (DL), including cofinancing of operating costs associated with the implementation of the project. The mandate holder, DL, is an employee of KU Leuven and his work activities take place in KU Leuven. Tom Van de Putte is the industrial promoter of DL and employee of TiGenix NV. This however does not alter the authors’ adherence to PLOS ONE policies on sharing data and materials.

Figures

Figure 1
Figure 1. The activity of firefly luciferase in free solution or in intact 293T cells is dependent on available oxygen concentration.
(A) Total photon flux at normoxic (21% O2) and hypoxic (0% O2, via addition of 1% Na2SO3) conditions emitted from a luciferase-dependent bioluminescence reaction in intact cells or from an equal concentration in cell lysates. Error bars, ±1 s.d. unit; n ≥5. (B, C) Confocal fluorescence imaging of cell mitochondria in cells exposed to (B) normoxic or (C) hypoxic oxygen concentrations. Images are maximum intensity projections of cell mitochondria stained with MitoTracker Red (red), cell nucleus stained with Hoechst (blue), and GFP signal (green) from stably transduced 293T cells. Left and right panels show the stained mitochondria with or without the other two channels, to reveal background fluorescence. Scale bar, 10 µm.
Figure 2
Figure 2. The available oxygen concentration induces changes in luciferase enzyme kinetics.
(A, B) Dynamic time point analysis of luciferase activity with varying luciferin concentrations measured at (A) normoxic and (B) at hypoxic conditions. Measured data points were extrapolated with exponential functions to resolve the initial enzyme activity. Error bars, ±1 s.d. unit; n ≥3. (C) Lineweaver-Burk plots of initial luciferase activity show the influence of available oxygen concentration on bioluminescence kinetics-related parameters, at normoxia (R2 = 0.74) and at hypoxia (R2 = 0.94). Enzyme kinetics for intermediate oxygen levels (solid black lines –5, 10 and 15% O2 from top to bottom) are determined from a square root dependent relationship with available oxygen concentration. (D, E) Average photon flux emitted from cell lysates or intact cells at different oxygen concentrations. Simulation results (dashed lines) are shown for (D) short and (E) long term analyses. Cells incubated in hypoxic conditions display a delayed bioluminescence peak activity. (F) Bioluminescence microscopy of intact cells imaged at saturated (21% O2) oxygen concentrations (initial luciferin concentrations, 470 µM). Scale bar, 20 µm.
Figure 3
Figure 3. Overview of the mechanisms involved in bioluminescence photon emission from luciferase reporter cells embedded in a hydrogel.
These mechanisms are implemented in the mathematical bioluminescence-oxygen model to decouple intrinsic bioluminescence intensities from the cellular oxygen environment. (A) Illustrated overview of the bioluminescence reaction in intact cells. Oxygen (iv) and luciferin (iii) pass through an extracellular matrix prior to cellular uptake. Diffusion rates are obtained from Fluorescence Recovery After Photobleaching (FRAP). Luciferin is actively transported across the cell membrane (thickness, λc) and reacts with luciferase (ii) in the cell cytoplasm where this reaction is accompanied by the release of a photon (i). Oxygen availability in the cytoplasm modulates emitted light intensity and kinetics and is described by the Michaelis-Menten kinetics. (B) Setup for validation of the bioluminescence-oxygen model. Oxygen Sensing microBeads (i) and 293T cells (ii) are embedded in an agarose gel that is confined between 2 circular glass plates. Focal volume (v) imaged by combined bioluminescence and fluorescence microscopy reveals luciferase activity in single intact cells (iii) and local oxygen concentrations based on ratiometric intensities obtained from oxygen sensitive and insensitive dyes (iv). Scale bar, 1mm. Scale bar figure insets, 10 µm. (C) Radial oxygen concentration profiles in cell-seeded agarose gels measured by fluorescence intensities from embedded OSB. Colored lines indicate fitted oxygen profiles simulated by the oxygen model. Empty control gels (Contr) are imaged after 1, 2 and 3 days of incubation. Error bars, ±1 s.d. unit; n ≥3. (D) Polar plot of time-dependent changes in fluorescein tracer diffusion rates as measured by FRAP. R-axis of polar plot indicates tracer diffusion rate (µm2·s−1). FRAP analysis showed no significant difference in average values (dashed lines) at day 1 (red, top left panel), day 2 (green, top right panel), and day 3 (blue, bottom left panel). Spatial heterogeneities in diffusion rate within the agarose gel were determined from measurements at various radial (r1 = 1 mm, red; r2 = 2 mm, green; and r3 = 3 mm, blue) and angular positions in the gel. Empty control gel (black, bottom right panel) is shown as a reference. Measurements are performed in duplicate with a small shift in spatial position, n ≥3.
Figure 4
Figure 4. Validation of the bioluminescence-oxygen model for quantitative interpretation and analysis of bioluminescent light emitted from cell-seeded hydrogels.
(A) Average photon flux measured for luciferase reporter 293T cells embedded in agarose gels that are axially confined by circular glass plates. Dynamic time point measurements were performed during 12 hour periods. (initial luciferin concentration, 47 µM) Error bars, ±1 s.d. unit; n ≥3 (B) Emission peak intensities were fitted by Gaussian functions. Time-lapse measurements of the average emitted photon flux were compared with simulation results from the bioluminescence-oxygen model in presence or absence of oxygen gradients at day 1 (C), day 2 (D), and day 3 (E). (F) Comparison of simulated peak emission intensities in presence (blue) or absence (orange) of oxygen gradients, with average viable cell densities obtained from quantitative DNA analyses (gray). Error bars, ±1 s.d. unit; n = 6. (G) 2D bioluminescence profiles of cell-seeded agarose gels imaged from top position (hydrogel diameter, 8 mm). Profiles above the dashed lines are measured with the IVIS 100, and profiles below are simulated from the bioluminescence-oxygen model. The left column shows activity at the peak position and the right column shows activity after 6 h (steady-state condition) (H) Bioluminescence microscopy of 293T cells embedded in agarose at the central hydrogel position and (I) comparison with the simulated activity in the hydrogel center.

Similar articles

Cited by

References

    1. Gilbert PM, Havenstrite KL, Magnusson KE, Sacco A, Leonardi NA, et al. (2010) Substrate elasticity regulates skeletal muscle stem cell self-renewal in culture. Science 329: 1078–81. - PMC - PubMed
    1. Weiss MS, Bernabe BP, Bellis AD, Broadbelt LJ, Jeruss JS, et al. (2010) Dynamic, Large-Scale Profiling of Transcription Factor Activity from Live Cells in 3D Culture. PLoS One 5: e14026. - PMC - PubMed
    1. Dunn CA, Jin QM, Taba M, Franceschi RT, Rutherford RB, et al. (2005) BMP gene delivery for alveolar bone engineering at dental implant defects. Mol Ther 11: 294–9. - PMC - PubMed
    1. McMillin DW, Delmore J, Weisberg E, Negri JM, Geer DC, et al. (2010) Tumor cell-specific bioluminescence platform to identify stroma-induced changes to anticancer drug activity. Nat Med 16: 483–U171. - PMC - PubMed
    1. Roda A, Guardigli M, Michelini E, Mirasoli M (2009) Bioluminescence in analytical chemistry and in vivo imaging. Trends Anal Chem 28: 307–22.

Publication types

LinkOut - more resources