

Computational fluid dynamics endpoints for assessment of adenotonsillectomy outcome in obese children with obstructive sleep apnea syndrome
- PMID: 24840295
- PMCID: PMC4057952
- DOI: 10.1016/j.jbiomech.2014.03.023
Computational fluid dynamics endpoints for assessment of adenotonsillectomy outcome in obese children with obstructive sleep apnea syndrome
Abstract
Background: Improvements in obstructive sleep apnea syndrome (OSAS) severity may be associated with improved pharyngeal fluid mechanics following adenotonsillectomy (AT). The study objective is to use image-based computational fluid dynamics (CFD) to model changes in pharyngeal pressures after AT, in obese children with OSAS and adenotonsillar hypertrophy.
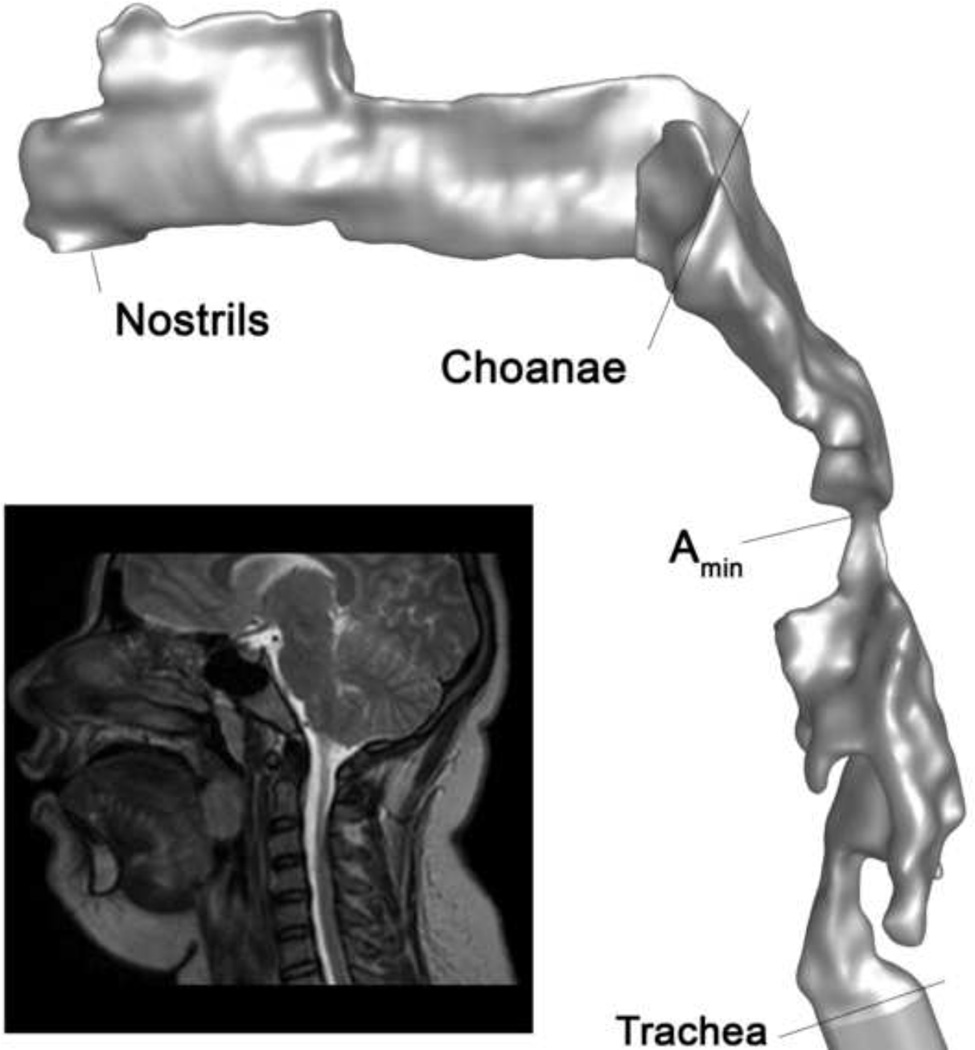
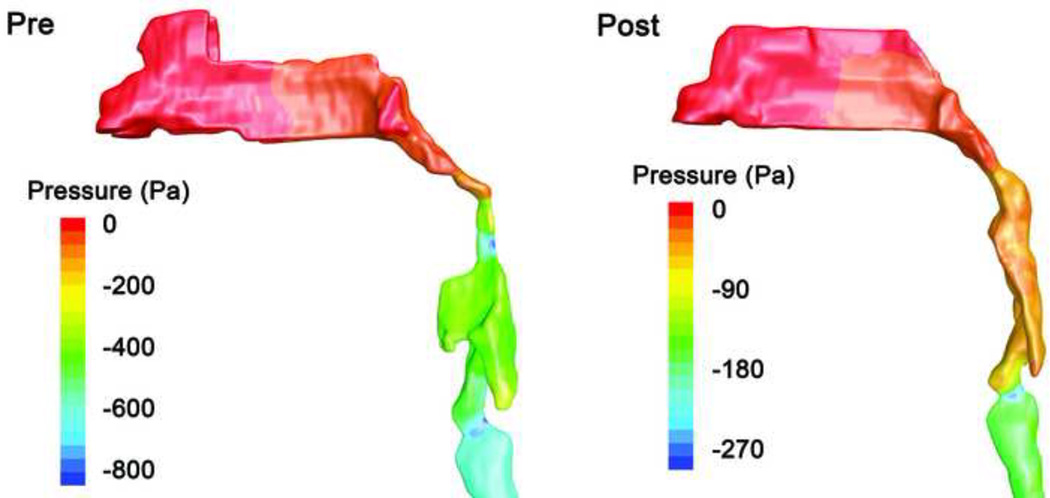
Methods: Three-dimensional models of the upper airway from nares to trachea, before and after AT, were derived from magnetic resonance images obtained during wakefulness, in a cohort of 10 obese children with OSAS. Velocity, pressure, and turbulence fields during peak tidal inspiratory flow were computed using commercial software. CFD endpoints were correlated with polysomnography endpoints before and after AT using Spearman׳s rank correlation (rs).
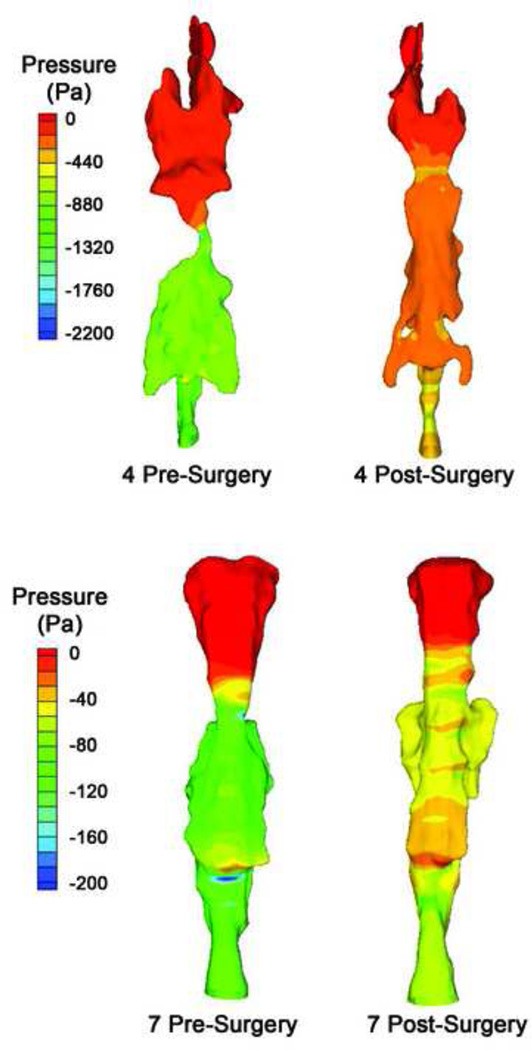
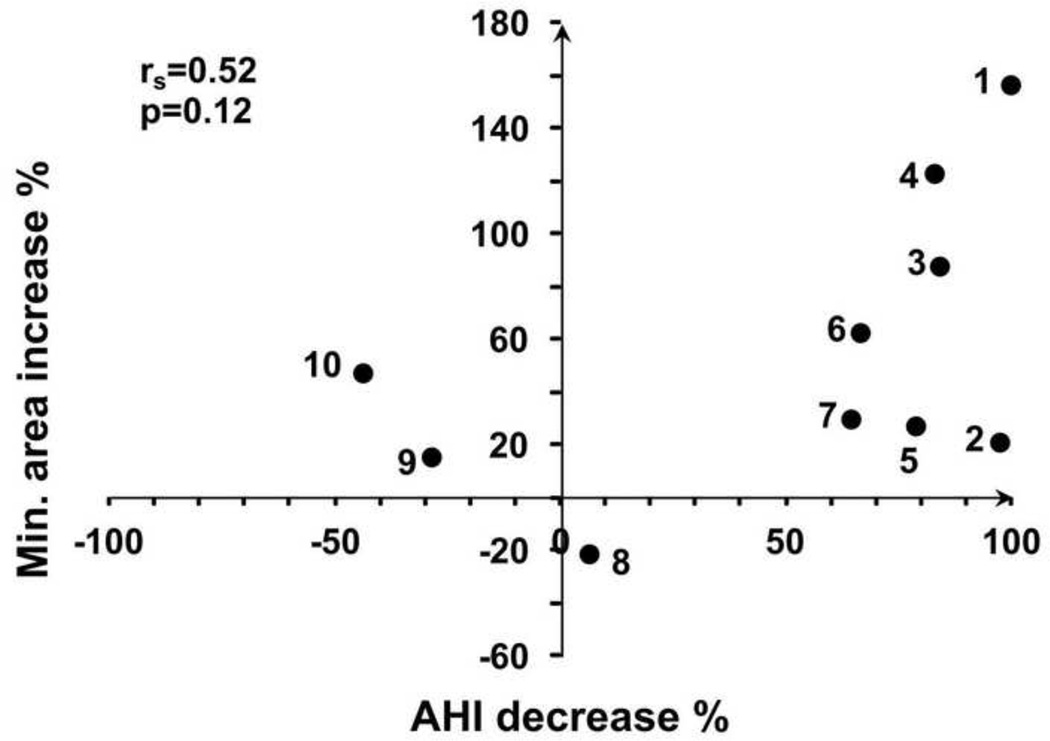
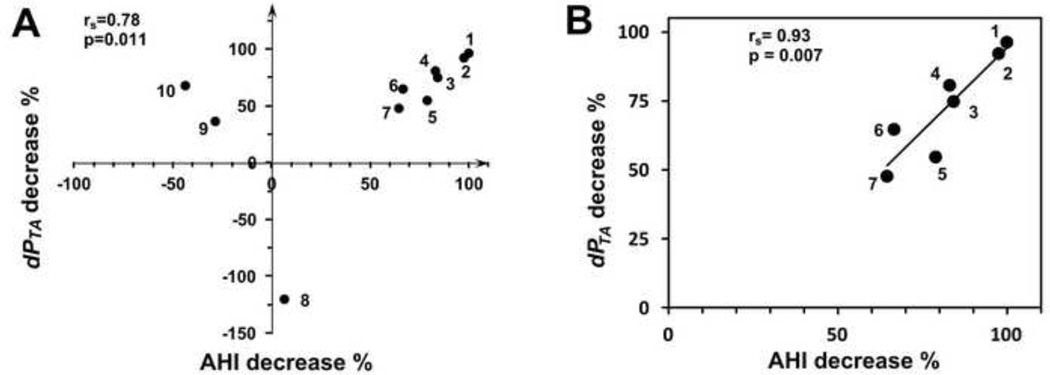
Results: Apnea hypopnea index (AHI) decreases after AT was strongly correlated with reduction in maximum pressure drop (dPTAmax) in the region where tonsils and adenoid constrict the pharynx (rs=0.78, P=0.011), and with decrease of the ratio of dPTAmax to flow rate (rs=0.82, P=0.006). Correlations of AHI decrease to anatomy, negative pressure in the overlap region (including nasal flow resistance), or pressure drop through the entire pharynx, were not significant. In a subgroup of subjects with more than 10% improvement in AHI, correlations between flow variables and AHI decrease were stronger than in all subjects.
Conclusions: The correlation between change in dPTAmax and improved AHI suggests that dPTAmax may be a useful index for internal airway loading due to anatomical narrowing, and may be better correlated with AHI than direct airway anatomic measurements.
Keywords: Airway resistance; Computer simulation; Humans; Magnetic resonance imaging; Pediatrics.
Copyright © 2014 Elsevier Ltd. All rights reserved.
Figures
Similar articles
-
Computational fluid dynamics upper airway effective compliance, critical closing pressure, and obstructive sleep apnea severity in obese adolescent girls.J Appl Physiol (1985). 2016 Oct 1;121(4):925-931. doi: 10.1152/japplphysiol.00190.2016. Epub 2016 Jul 21. J Appl Physiol (1985). 2016. PMID: 27445297 Free PMC article.
-
Computational fluid dynamics endpoints to characterize obstructive sleep apnea syndrome in children.J Appl Physiol (1985). 2014 Jan 1;116(1):104-12. doi: 10.1152/japplphysiol.00746.2013. Epub 2013 Nov 21. J Appl Physiol (1985). 2014. PMID: 24265282 Free PMC article.
-
[Study on simulated airflow dynamics of children with obstructive sleep apnea treated by different surgical methods].Lin Chuang Er Bi Yan Hou Tou Jing Wai Ke Za Zhi. 2024 Dec;38(12):1161-1165;1169. doi: 10.13201/j.issn.2096-7993.2024.12.013. Lin Chuang Er Bi Yan Hou Tou Jing Wai Ke Za Zhi. 2024. PMID: 39605267 Free PMC article. Chinese.
-
Clinical Practice Guideline: Tonsillectomy in Children (Update)-Executive Summary.Otolaryngol Head Neck Surg. 2019 Feb;160(2):187-205. doi: 10.1177/0194599818807917. Otolaryngol Head Neck Surg. 2019. PMID: 30921525 Review.
-
Adenotonsillectomy: the good, the bad and the unknown.Curr Opin Pulm Med. 2022 Nov 1;28(6):537-542. doi: 10.1097/MCP.0000000000000911. Epub 2022 Aug 30. Curr Opin Pulm Med. 2022. PMID: 36039903 Free PMC article. Review.
Cited by
-
Postoperative functional evaluation of obstructive sleep apnea syndrome by computational fluid dynamics.Indian J Otolaryngol Head Neck Surg. 2022 Dec;74(Suppl 3):5044-5051. doi: 10.1007/s12070-021-02681-y. Epub 2021 Jun 16. Indian J Otolaryngol Head Neck Surg. 2022. PMID: 36742941 Free PMC article.
-
Upper Airway Flow Dynamics in Obstructive Sleep Apnea Patients with Various Apnea-Hypopnea Index.Life (Basel). 2022 Jul 19;12(7):1080. doi: 10.3390/life12071080. Life (Basel). 2022. PMID: 35888168 Free PMC article.
-
Efficacy of minimally invasive tonsil surgery for treatment of obstructive sleep apnea-hypopnea syndrome in children.Braz J Med Biol Res. 2017 Apr 20;50(5):e5846. doi: 10.1590/1414-431X20175846. Braz J Med Biol Res. 2017. PMID: 28443988 Free PMC article.
-
A preoperative predictive study of advantages of airway changes after maxillomandibular advancement surgery using computational fluid dynamics analysis.PLoS One. 2021 Aug 11;16(8):e0255973. doi: 10.1371/journal.pone.0255973. eCollection 2021. PLoS One. 2021. PMID: 34379704 Free PMC article.
-
Computational fluid dynamics upper airway effective compliance, critical closing pressure, and obstructive sleep apnea severity in obese adolescent girls.J Appl Physiol (1985). 2016 Oct 1;121(4):925-931. doi: 10.1152/japplphysiol.00190.2016. Epub 2016 Jul 21. J Appl Physiol (1985). 2016. PMID: 27445297 Free PMC article.
References
-
- American Academy of Pediatrics, So. P.P., Subcommittee on Obstructive Sleep Apnea Syndrome. Clinical practice guideline: diagnosis and management of childhood obstructive sleep apnea syndrome. Pediatrics. 2002;109:704–712. - PubMed
-
- Arens R, McDonough JM, Corbin AM, Hernandez EM, Maislin G, Schwab RJ, Pack AI. Linear dimensions of the upper airway structure during development: assessment by magnetic resonance imaging. Am J Respir Crit Care Med. 2002;165:117–122. - PubMed
-
- Arens R, McDonough JM, Corbin AM, Rubin NK, Carroll ME, Pack AI, Liu J, Udupa JK. Upper airway size analysis by magnetic resonance imaging of children with obstructive sleep apnea syndrome. Am J Respir Crit Care Med. 2003;167:65–70. - PubMed
-
- Arens R, McDonough JM, Costarino AT, Mahboubi S, Tayag-Kier CE, Maislin G, Schwab RJ, Pack AI. Magnetic resonance imaging of the upper airway structure of children with obstructive sleep apnea syndrome. Am J Respir Crit Care Med. 2001;164:698–703. - PubMed
-
- Block AJ, Faulkner JA, Hughes RL, Remmers JE, Thach B. Clinical conference in pulmonary disease. Factors influencing upper airway closure. Chest. 1984;86:114–122. - PubMed
Publication types
MeSH terms
Grants and funding
LinkOut - more resources
Full Text Sources
Other Literature Sources
Medical
Miscellaneous
