

In vitro treatment of melanoma brain metastasis by simultaneously targeting the MAPK and PI3K signaling pathways
- PMID: 24840574
- PMCID: PMC4057758
- DOI: 10.3390/ijms15058773
In vitro treatment of melanoma brain metastasis by simultaneously targeting the MAPK and PI3K signaling pathways
Abstract
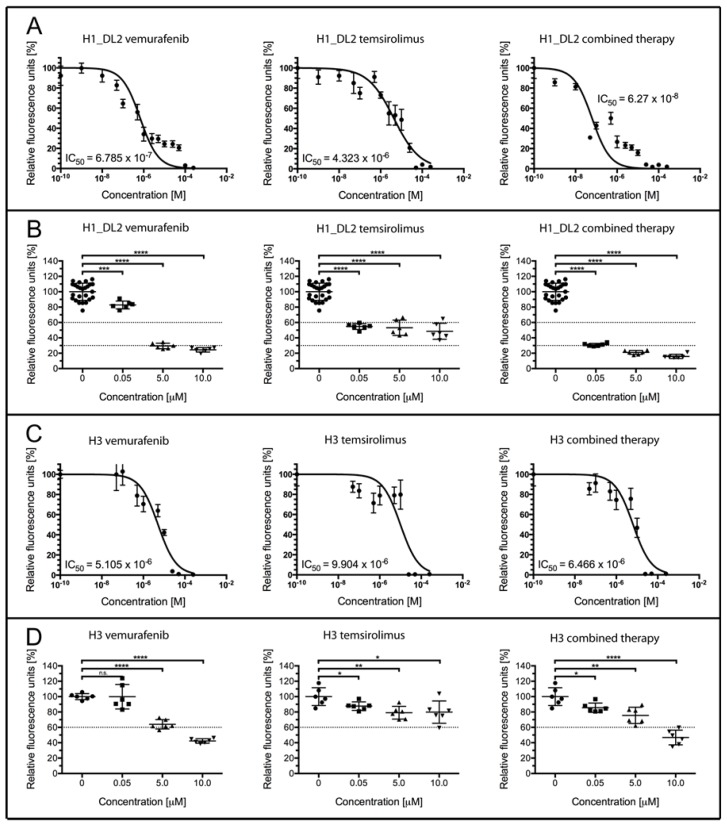
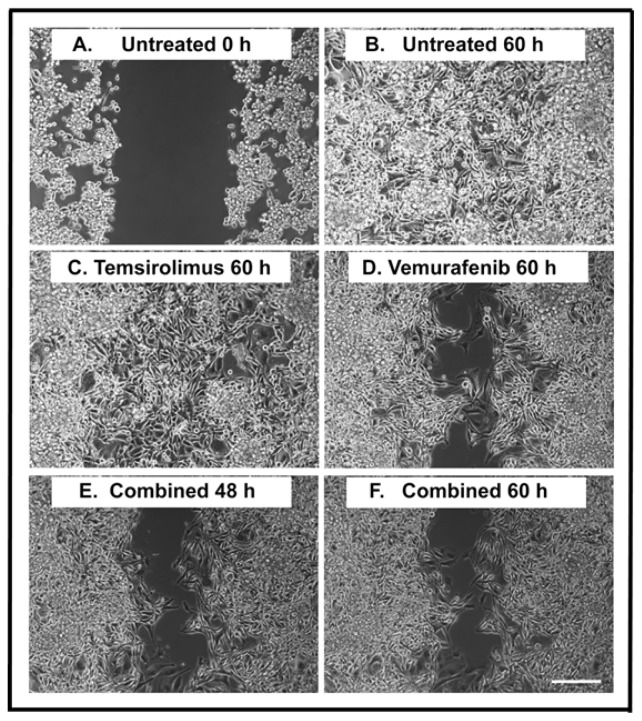
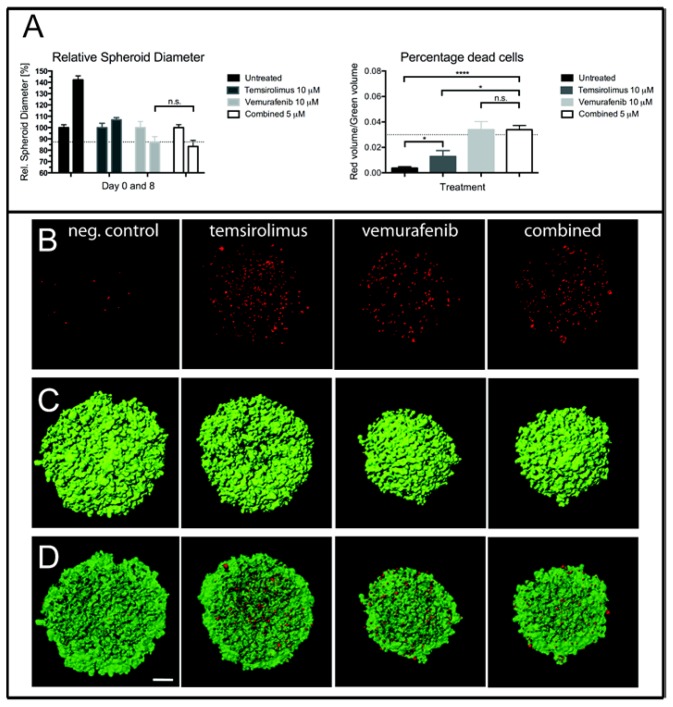
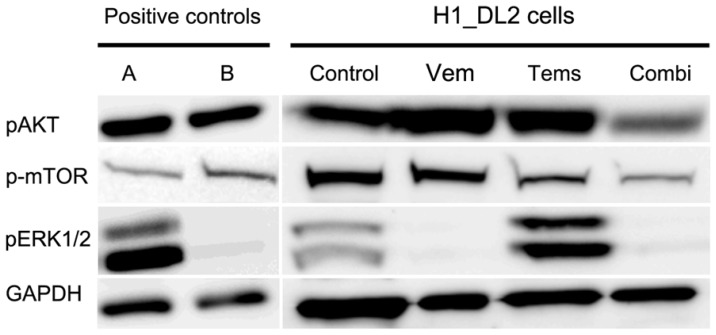
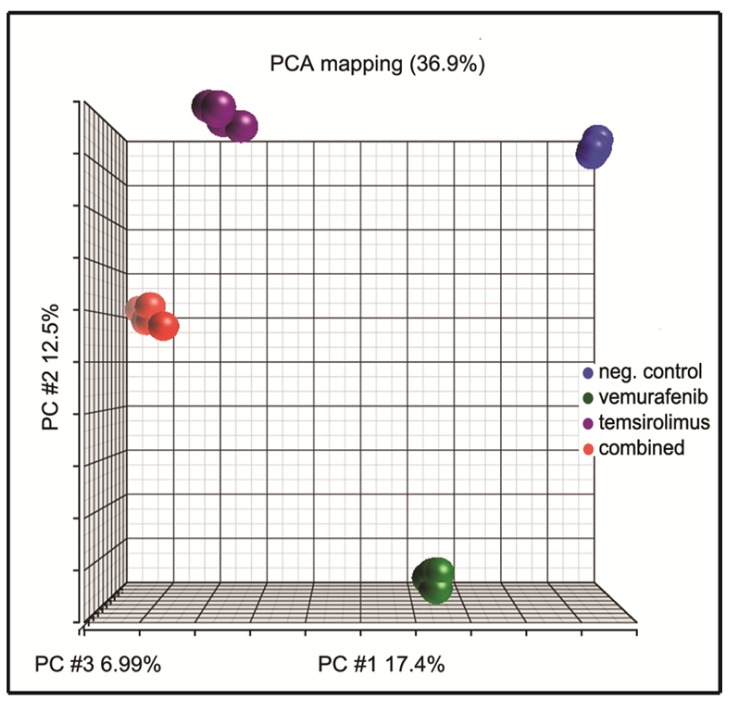
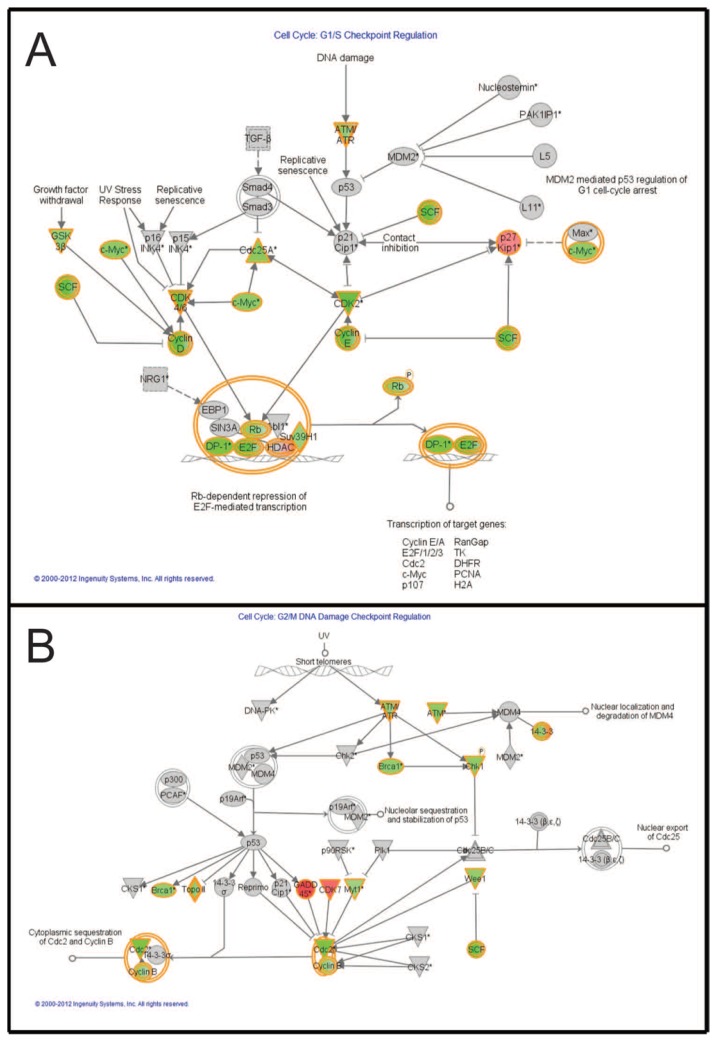
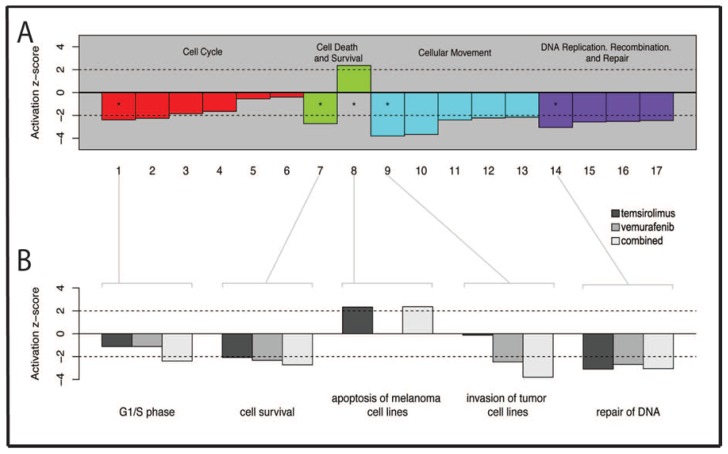
Malignant melanoma is the most lethal form of skin cancer, with a high propensity to metastasize to the brain. More than 60% of melanomas have the BRAFV600E mutation, which activates the mitogen-activated protein kinase (MAPK) pathway [1]. In addition, increased PI3K (phosphoinositide 3-kinase) pathway activity has been demonstrated, through the loss of activity of the tumor suppressor gene, PTEN [2]. Here, we treated two melanoma brain metastasis cell lines, H1_DL2, harboring a BRAFV600E mutation and PTEN loss, and H3, harboring WT (wild-type) BRAF and PTEN loss, with the MAPK (BRAF) inhibitor vemurafenib and the PI3K pathway associated mTOR inhibitor temsirolimus. Combined use of the drugs inhibited tumor cell growth and proliferation in vitro in H1_DL2 cells, compared to single drug treatment. Treatment was less effective in the H3 cells. Furthermore, a strong inhibitory effect on the viability of H1_DL2 cells, when grown as 3D multicellular spheroids, was seen. The treatment inhibited the expression of pERK1/2 and reduced the expression of pAKT and p-mTOR in H1_DL2 cells, confirming that the MAPK and PI3K pathways were inhibited after drug treatment. Microarray experiments followed by principal component analysis (PCA) mapping showed distinct gene clustering after treatment, and cell cycle checkpoint regulators were affected. Global gene analysis indicated that functions related to cell survival and invasion were influenced by combined treatment. In conclusion, we demonstrate for the first time that combined therapy with vemurafenib and temsirolimus is effective on melanoma brain metastasis cells in vitro. The presented results highlight the potential of combined treatment to overcome treatment resistance that may develop after vemurafenib treatment of melanomas.
Figures
Similar articles
-
Resistance to BRAF inhibition in BRAF-mutant colon cancer can be overcome with PI3K inhibition or demethylating agents.Clin Cancer Res. 2013 Feb 1;19(3):657-67. doi: 10.1158/1078-0432.CCR-11-1446. Epub 2012 Dec 18. Clin Cancer Res. 2013. PMID: 23251002 Free PMC article.
-
Acyclic Retinoid Overcomes Vemurafenib Resistance in Melanoma Cells via Dual Inhibition of MAPK and PI3K/AKT/mTOR Pathways.Anticancer Res. 2025 Jun;45(6):2265-2278. doi: 10.21873/anticanres.17601. Anticancer Res. 2025. PMID: 40425334
-
Repurposing the serotonin agonist Tegaserod as an anticancer agent in melanoma: molecular mechanisms and clinical implications.J Exp Clin Cancer Res. 2020 Feb 21;39(1):38. doi: 10.1186/s13046-020-1539-7. J Exp Clin Cancer Res. 2020. PMID: 32085796 Free PMC article.
-
Mechanisms of resistance to RAF inhibition in melanomas harboring a BRAF mutation.Am Soc Clin Oncol Educ Book. 2013. doi: 10.14694/EdBook_AM.2013.33.e80. Am Soc Clin Oncol Educ Book. 2013. PMID: 23714462 Review.
-
Vemurafenib: targeted inhibition of mutated BRAF for treatment of advanced melanoma and its potential in other malignancies.Drugs. 2012 Dec 3;72(17):2207-22. doi: 10.2165/11640870-000000000-00000. Drugs. 2012. PMID: 23116250 Review.
Cited by
-
Effective Treatment of Metastatic Melanoma by Combining MAPK and PI3K Signaling Pathway Inhibitors.Int J Mol Sci. 2019 Aug 29;20(17):4235. doi: 10.3390/ijms20174235. Int J Mol Sci. 2019. PMID: 31470659 Free PMC article.
-
Metabotropic glutamate receptors in cancer.Neuropharmacology. 2017 Mar 15;115:193-202. doi: 10.1016/j.neuropharm.2016.02.011. Epub 2016 Feb 16. Neuropharmacology. 2017. PMID: 26896755 Free PMC article. Review.
-
PTEN status is a crucial determinant of the functional outcome of combined MEK and mTOR inhibition in cancer.Sci Rep. 2017 Feb 21;7:43013. doi: 10.1038/srep43013. Sci Rep. 2017. PMID: 28220839 Free PMC article.
-
The investigation of ceranib-2 on apoptosis and drug interaction with carboplatin in human non small cell lung cancer cells in vitro.Cytotechnology. 2018 Feb;70(1):387-396. doi: 10.1007/s10616-017-0154-8. Epub 2017 Dec 11. Cytotechnology. 2018. PMID: 29230631 Free PMC article.
-
CRISPR/Cas9 Mediated Knockout of Cyclooxygenase-2 Gene Inhibits Invasiveness in A2058 Melanoma Cells.Cells. 2022 Feb 21;11(4):749. doi: 10.3390/cells11040749. Cells. 2022. PMID: 35203404 Free PMC article.
References
-
- Brose M.S., Volpe P., Feldman M., Kumar M., Rishi I., Gerrero R., Einhorn E., Herlyn M., Minna J., Nicholson A., et al. BRAF and RAS mutations in human lung cancer and melanoma. Cancer Res. 2002;62:6997–7000. - PubMed
-
- Margolin K., Longmate J., Baratta T., Synold T., Christensen S., Weber J., Gajewski T., Quirt I., Doroshow J.H. CCI-779 in metastatic melanoma: A phase II trial of the California Cancer Consortium. Cancer. 2005;104:1045–1048. - PubMed
-
- Fonkem E., Uhlmann E.J., Floyd S.R., Mahadevan A., Kasper E., Eton O., Wong E.T. Melanoma brain metastasis: Overview of current management and emerging targeted therapies. Expert Rev. Neurother. 2012;12:1207–1215. - PubMed
-
- Tosoni A., Ermani M., Brandes A.A. The pathogenesis and treatment of brain metastases: A comprehensive review. Critical Rev. Oncol. Hematol. 2004;52:199–215. - PubMed
Publication types
MeSH terms
Substances
LinkOut - more resources
Full Text Sources
Other Literature Sources
Molecular Biology Databases
Research Materials
Miscellaneous
