Light and circadian regulation of clock components aids flexible responses to environmental signals
- PMID: 24842166
- PMCID: PMC4286021
- DOI: 10.1111/nph.12853
Light and circadian regulation of clock components aids flexible responses to environmental signals
Abstract
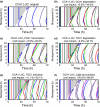
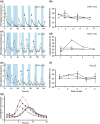
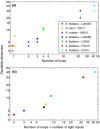
The circadian clock measures time across a 24 h period, increasing fitness by phasing biological processes to the most appropriate time of day. The interlocking feedback loop mechanism of the clock is conserved across species; however, the number of loops varies. Mathematical and computational analyses have suggested that loop complexity affects the overall flexibility of the oscillator, including its responses to entrainment signals. We used a discriminating experimental assay, at the transition between different photoperiods, in order to test this proposal in a minimal circadian network (in Ostreococcus tauri) and a more complex network (in Arabidopsis thaliana). Transcriptional and translational reporters in O. tauri primarily tracked dawn or dusk, whereas in A. thaliana, a wider range of responses were observed, consistent with its more flexible clock. Model analysis supported the requirement for this diversity of responses among the components of the more complex network. However, these and earlier data showed that the O. tauri network retains surprising flexibility, despite its simple circuit. We found that models constructed from experimental data can show flexibility either from multiple loops and/or from multiple light inputs. Our results suggest that O. tauri has adopted the latter strategy, possibly as a consequence of genomic reduction.
Keywords: biological clocks; flexibility; marine algae; mathematical analysis; nonlinear dynamics; photoperiod; systems biology.
© 2014 The Authors. New Phytologist © 2014 New Phytologist Trust.
Figures


Similar articles
-
Multiple light inputs to a simple clock circuit allow complex biological rhythms.Plant J. 2011 Apr;66(2):375-85. doi: 10.1111/j.1365-313X.2011.04489.x. Plant J. 2011. PMID: 21219507 Free PMC article.
-
Robust and flexible response of the Ostreococcus tauri circadian clock to light/dark cycles of varying photoperiod.FEBS J. 2012 Sep;279(18):3432-48. doi: 10.1111/j.1742-4658.2012.08666.x. Epub 2012 Jul 13. FEBS J. 2012. PMID: 22712559
-
A robust two-gene oscillator at the core of Ostreococcus tauri circadian clock.Chaos. 2010 Dec;20(4):045108. doi: 10.1063/1.3530118. Chaos. 2010. PMID: 21198120
-
Circadian clocks in changing weather and seasons: lessons from the picoalga Ostreococcus tauri.Bioessays. 2012 Sep;34(9):781-90. doi: 10.1002/bies.201200012. Epub 2012 Jul 16. Bioessays. 2012. PMID: 22806346 Review.
-
Circadian Rhythms in Plants.Cold Spring Harb Perspect Biol. 2019 Sep 3;11(9):a034611. doi: 10.1101/cshperspect.a034611. Cold Spring Harb Perspect Biol. 2019. PMID: 31138544 Free PMC article. Review.
Cited by
-
Probing entrainment of Ostreococcus tauri circadian clock by green and blue light through a mathematical modeling approach.Front Genet. 2015 Feb 27;6:65. doi: 10.3389/fgene.2015.00065. eCollection 2015. Front Genet. 2015. PMID: 25774167 Free PMC article.
-
Circadian entrainment in Arabidopsis.Plant Physiol. 2022 Sep 28;190(2):981-993. doi: 10.1093/plphys/kiac204. Plant Physiol. 2022. PMID: 35512209 Free PMC article.
-
Circadian-period variation underlies the local adaptation of photoperiodism in the short-day plant Lemna aequinoctialis.iScience. 2022 Jun 17;25(7):104634. doi: 10.1016/j.isci.2022.104634. eCollection 2022 Jul 15. iScience. 2022. PMID: 35800759 Free PMC article.
-
Stochastic models of cellular circadian rhythms in plants help to understand the impact of noise on robustness and clock structure.Front Plant Sci. 2014 Oct 21;5:564. doi: 10.3389/fpls.2014.00564. eCollection 2014. Front Plant Sci. 2014. PMID: 25374576 Free PMC article.
-
A Compact Model for the Complex Plant Circadian Clock.Front Plant Sci. 2016 Feb 5;7:74. doi: 10.3389/fpls.2016.00074. eCollection 2016. Front Plant Sci. 2016. PMID: 26904049 Free PMC article.
References
-
- Alabadi D, Oyama T, Yanovsky MJ, Harmon FG, Mas P, Kay SA. Reciprocal regulation between TOC1 and LHY/CCA1 within the Arabidopsis circadian clock. Science. 2001;293:880–883. - PubMed
Publication types
MeSH terms
Substances
Grants and funding
- BB/J009423/1/BB_/Biotechnology and Biological Sciences Research Council/United Kingdom
- BB/F005237/1/BB_/Biotechnology and Biological Sciences Research Council/United Kingdom
- BB/D019621/1/BB_/Biotechnology and Biological Sciences Research Council/United Kingdom
- BB/J009423/BB_/Biotechnology and Biological Sciences Research Council/United Kingdom
LinkOut - more resources
Full Text Sources
Other Literature Sources

