

Theta dynamics in rat: speed and acceleration across the Septotemporal axis
- PMID: 24842406
- PMCID: PMC4026415
- DOI: 10.1371/journal.pone.0097987
Theta dynamics in rat: speed and acceleration across the Septotemporal axis
Abstract
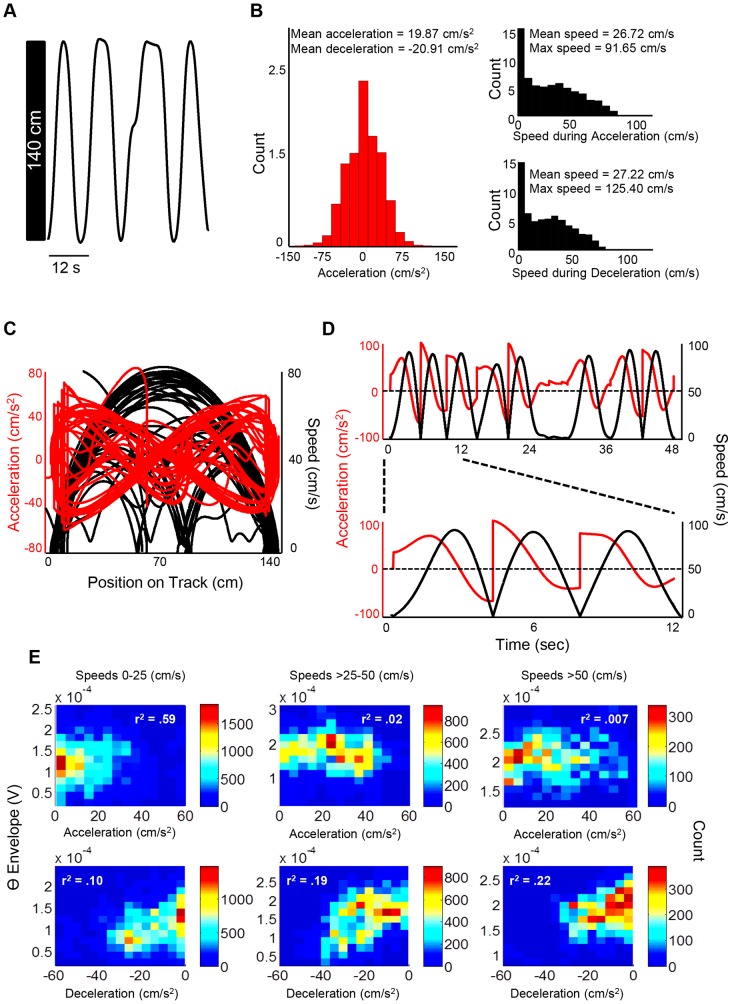
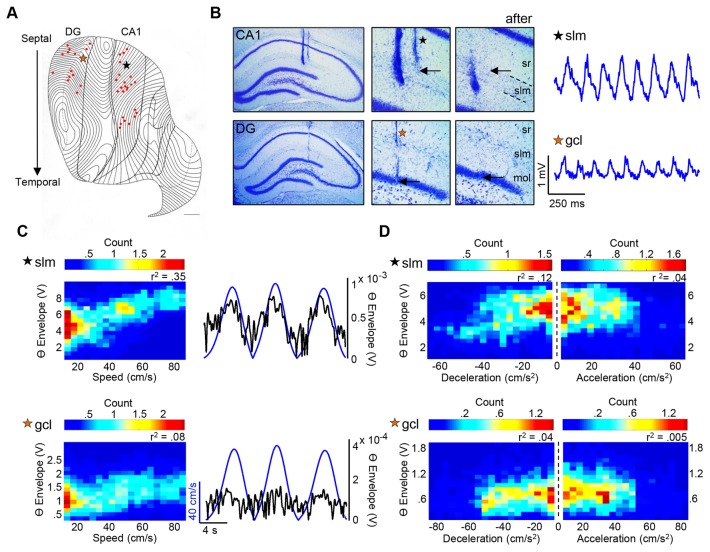
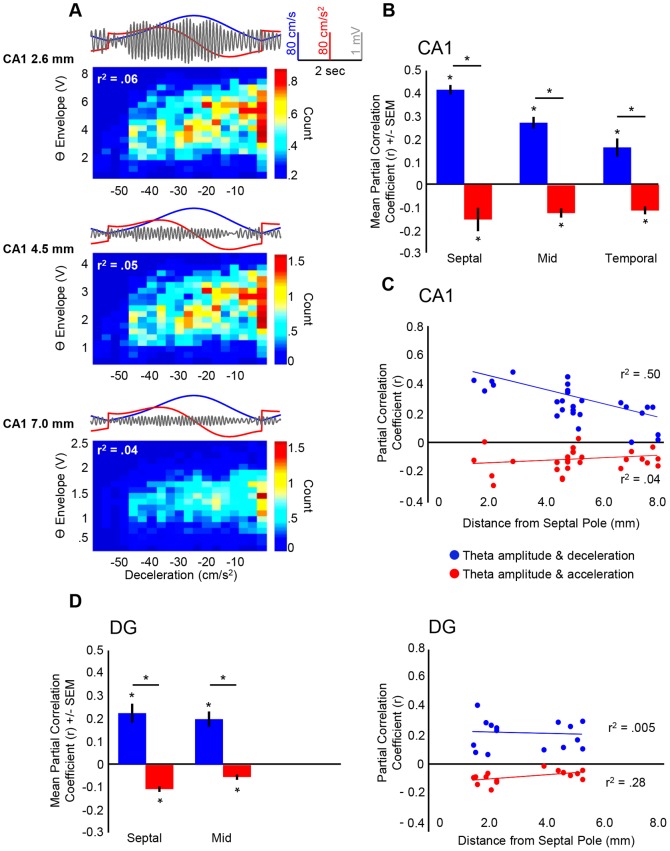
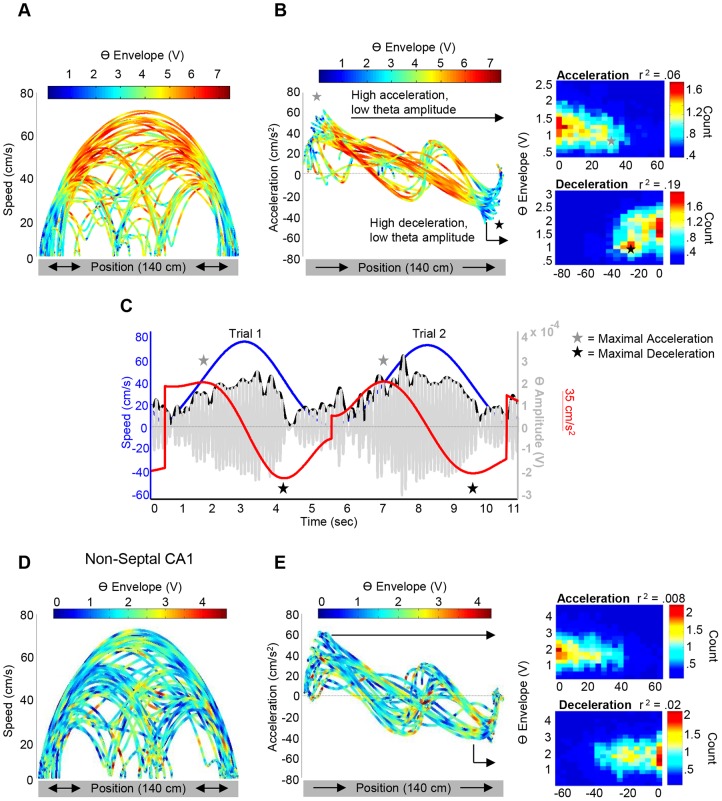
Theta (6-12 Hz) rhythmicity in the local field potential (LFP) reflects a clocking mechanism that brings physically isolated neurons together in time, allowing for the integration and segregation of distributed cell assemblies. Variation in the theta signal has been linked to locomotor speed, sensorimotor integration as well as cognitive processing. Previously, we have characterized the relationship between locomotor speed and theta power and how that relationship varies across the septotemporal (long) axis of the hippocampus (HPC). The current study investigated the relationship between whole body acceleration, deceleration and theta indices at CA1 and dentate gyrus (DG) sites along the septotemporal axis of the HPC in rats. Results indicate that whole body acceleration and deceleration predicts a significant amount of variability in the theta signal beyond variation in locomotor speed. Furthermore, deceleration was more predictive of variation in theta amplitude as compared to acceleration as rats traversed a linear track. Such findings highlight key variables that systematically predict the variability in the theta signal across the long axis of the HPC. A better understanding of the relative contribution of these quantifiable variables and their variation as a function of experience and environmental conditions should facilitate our understanding of the relationship between theta and sensorimotor/cognitive functions.
Conflict of interest statement
Figures
Similar articles
-
Septotemporal variation in dynamics of theta: speed and habituation.J Neurophysiol. 2011 Jun;105(6):2675-86. doi: 10.1152/jn.00837.2010. Epub 2011 Mar 16. J Neurophysiol. 2011. PMID: 21411562
-
Theta variation and spatiotemporal scaling along the septotemporal axis of the hippocampus.Front Syst Neurosci. 2015 Mar 16;9:37. doi: 10.3389/fnsys.2015.00037. eCollection 2015. Front Syst Neurosci. 2015. PMID: 25852496 Free PMC article. Review.
-
Ketamine disrupts theta synchrony across the septotemporal axis of the CA1 region of hippocampus.J Neurophysiol. 2013 Jan;109(2):570-9. doi: 10.1152/jn.00561.2012. Epub 2012 Oct 31. J Neurophysiol. 2013. PMID: 23114214
-
Novel acoustic stimuli can alter locomotor speed to hippocampal theta relationship.Hippocampus. 2014 Sep;24(9):1053-8. doi: 10.1002/hipo.22308. Epub 2014 Jun 16. Hippocampus. 2014. PMID: 24866396
-
[Theta rhythm recorded in the hippocampal formation in vitro].Postepy Hig Med Dosw (Online). 2013 Jul 15;67:617-30. doi: 10.5604/17322693.1058537. Postepy Hig Med Dosw (Online). 2013. PMID: 24018425 Review. Polish.
Cited by
-
A Direct Comparison of Theta Power and Frequency to Speed and Acceleration.J Neurosci. 2022 May 25;42(21):4326-4341. doi: 10.1523/JNEUROSCI.0987-21.2022. Epub 2022 Apr 27. J Neurosci. 2022. PMID: 35477905 Free PMC article.
-
Proximodistal structure of theta coordination in the dorsal hippocampus of epileptic rats.J Neurosci. 2015 Mar 18;35(11):4760-75. doi: 10.1523/JNEUROSCI.4297-14.2015. J Neurosci. 2015. PMID: 25788692 Free PMC article.
-
Phase relations of interneuronal activity relative to theta rhythm.Front Neural Circuits. 2023 Jul 6;17:1198573. doi: 10.3389/fncir.2023.1198573. eCollection 2023. Front Neural Circuits. 2023. PMID: 37484208 Free PMC article.
-
Repeated Binge Alcohol Drinking Leads to Reductions in Corticostriatal Theta Coherence in Female but not Male Mice.bioRxiv [Preprint]. 2024 Mar 8:2024.03.07.581791. doi: 10.1101/2024.03.07.581791. bioRxiv. 2024. Update in: Neuropharmacology. 2025 Oct 1;277:110522. doi: 10.1016/j.neuropharm.2025.110522. PMID: 38496601 Free PMC article. Updated. Preprint.
-
The neural circuitry supporting successful spatial navigation despite variable movement speeds.Neurosci Biobehav Rev. 2020 Jan;108:821-833. doi: 10.1016/j.neubiorev.2019.11.013. Epub 2019 Nov 21. Neurosci Biobehav Rev. 2020. PMID: 31760048 Free PMC article. Review.
References
-
- Buzsaki G (1989) Two-stage model of memory trace formation: A role for “noisy” brain states. Neurosci 31: 551–570. - PubMed
-
- Buzsaki G, Chrobak JJ (1995) Temporal structure in spatially organizaed neuronal ensembles: a role for interneuronal networks. Curr Opin Neurobiol 5: 504–510. - PubMed
-
- Buzsaki G (2002) Theta oscillations in the hippocampus. Neuron 33: 325–340. - PubMed
-
- Gray CM (1994) Synchronous oscillations in neuronal systems: mechanism and functions. J Comp Neurosci 1: 11–38. - PubMed
Publication types
MeSH terms
LinkOut - more resources
Full Text Sources
Other Literature Sources
Miscellaneous
