. 2014 Jul;58(7):1561-73.
doi: 10.1002/mnfr.201300729. Epub 2014 May 19.

Interspecies communication between plant and mouse gut host cells through edible plant derived exosome-like nanoparticles

Affiliations

Interspecies communication between plant and mouse gut host cells through edible plant derived exosome-like nanoparticles

Jingyao Mu et al. Mol Nutr Food Res. 2014 Jul.

Erratum in

  • Erratum.
    [No authors listed] [No authors listed] Mol Nutr Food Res. 2016 Apr;60(4):964. doi: 10.1002/mnfr.201670044. Mol Nutr Food Res. 2016. PMID: 27061235 No abstract available.

Abstract

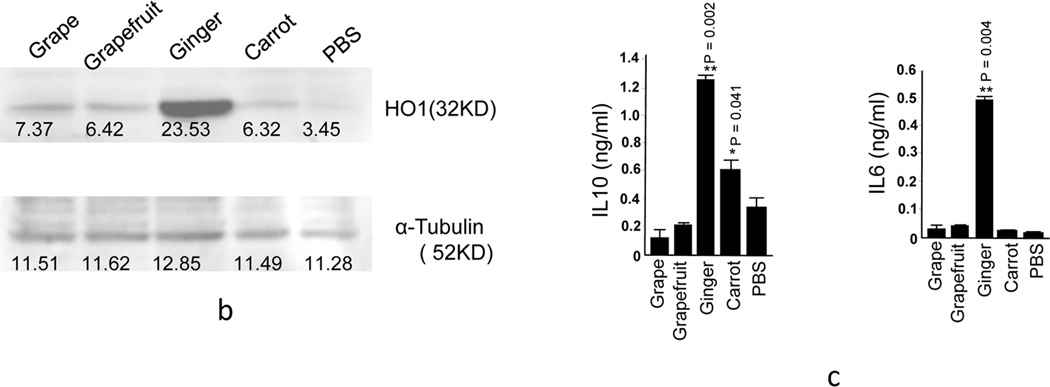
Scope: Exosomes, small vesicles participating in intercellular communication, have been extensively studied recently; however, the role of edible plant derived exosomes in interspecies communication has not been investigated. Here, we investigate the biological effects of edible plant derived exosome-like nanoparticles (EPDENs) on mammalian cells.

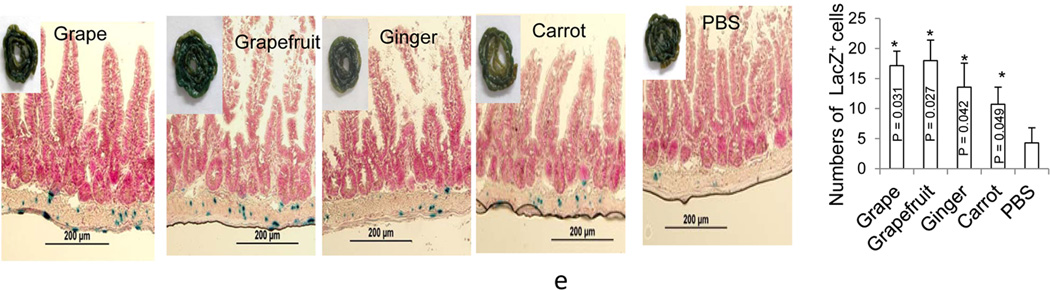
Methods and results: In this study, exosome-like nanoparticles from four edible plants were isolated and characterized. We show that these EPDENs contain proteins, lipids, and microRNA. EPDENs are taken up by intestinal macrophages and stem cells. The results generated from EPDEN-transfected macrophages indicate that ginger EPDENs preferentially induce the expression of the antioxidation gene, heme oxygenase-1 and the anti-inflammatory cytokine, IL-10; whereas grapefruit, ginger, and carrot EPDENs promote activation of nuclear factor like (erythroid-derived 2). Furthermore, analysis of the intestines of canonical Wnt-reporter mice, i.e. B6.Cg-Tg(BAT-lacZ)3Picc/J mice, revealed that the numbers of β-galactosidase(+) (β-Gal) intestinal crypts are increased, suggesting that EPDEN treatment of mice leads to Wnt-mediated activation of the TCF4 transcription machinery in the crypts.

Conclusion: The data suggest a role for EPDEN-mediated interspecies communication by inducing expression of genes for anti-inflammation cytokines, antioxidation, and activation of Wnt signaling, which are crucial for maintaining intestinal homeostasis.

Keywords: Anti-inflammation; Antioxidation; Edible plant exosomes; Intestinal macrophages; Nrf2.


Figures

Figure 1
Figure 1. Identification and characterization of edible plant derived exosomes-like nanoparticles (EPDENs)
(a) Three bands were formed after sucrose grandient ultracentrifugation. EPDENs from the 30%/45% interface were visualized by electromicroscopy. (b) Size distribution and (c) surface Zeta-potential of the particles was determined using the Zetasizer Nano ZS. (d) 50 µg of EPDENs were run on 10% SDS PAGE protein gels and detected with Coomassie Blue staining (left panel). Lipids were detected by TLC (right panel) analysis of the lipid extracts from EPDENs. The lipids extracted from EPDENs were separated on a thin-layer chromatography plate and developed by spraying the plate with a 10% copper sulfate and 8% phosphoric acid solution. A representative image was scanned using an Odyssey Scanner. (e) After electrophoresis on the 12% polyacrylamide gel, EPDEN RNA pretreated with/without RNase was stained with ethidium bromide and visualized with a UVP PhotoDoc-It™ Imaging System. (f) Sucrose purified EPDENs were weighed and expressed as mg of EPDENs /100 g of edible plant (left panel), total RNA from EPDENs was quantified using Nanodrop spectrophotometry to measure absorbance at 260 nm, and expresssed as µg of RNA/100 mg of EPDENs (middel panel). Error bars represent standard deviation (±SD) (** p<0.01, * p<0.05). ClustalX2 analysis of grape EPDEN-miRNA homologue sequencing (right panel). The highlighted nucleotides represent highly conserved regions of the grape EPDEN miRNA domains to human miRNAs. Results (a–e) represent one of four independent experiments.
Figure 2
Figure 2. EPDENs are resistant to gastric and intestinal enzymatic digestion
EPDENs were incubated in water (left column) or a stomach-like solution (middle column) at 37°C for 30 min or first in stomach-like solution at 37°C for 30 min followed by incubation for 30 min in a small intestine-like solution. The change of particle size (a) and surface charge (b) were measured using a Zetasizer. Results (a-b) represent one of five independent experiments.
Figure 3
Figure 3. Intesinal macrophages and LGR5 stem cells take up orally administrated EPDENs
Female C57BL/6 mice (a) or Lgr5-EGFP-IRES-CreERT2 mice (b) were gavage administered PKH26 dye labeled EPDENs (1mg per mouse in 200 µl PBS). 6h after the administration, F4/80+/PKH26 cells (a) or Lgr5-EGFP+PKH26+ cells (b) in frozen sections of intestine were examined by confocal microscopy (left) and were quantified (right). Original magnification ×40. A representative image is presented (a,b, left panels, n=5). Error bars represent standard deviation (±SD) (a, b, right panels) (n = 5 mice per group).
Figure 4
Figure 4. Induction of anti-inflammation cytokines, anti-oxidation genes expressed in macrophages and actvation of the Wnt pathway in mice treated with EPDENs
(a–d) Twenty-four hr after RAW 264.7 macrophage treatment with EPDENs (1.0 ug/ml), (a) total RNA was isolated and the mRNA level of HO-1, IL-6, IL-10 and TNFα were determined by real-time PCR. Error bars represent standard deviation (±SD) (** p<0.01, * p<0.05). (b) EPDEN treated RAW 264.7 macrophages were lysed and the expression of HO-1 was western blot analyzed. A representative image (n=3/treatment) is shown. The density of each western blot band was quantified and is indicated under each band. (c) The supernatants from EPDEN treated RAW 264.7 macrophages were collected for ELISA quantitation of IL-10 and IL-6. Error bars represent standard deviation (±SD) (** p<0.01, * p<0.05). (d) EPDEN treated RAW 264.7 macrophages were stained with anti-Nrf2 and DAPI, and Nrf2+ cells were examined by confocal microscopy. One representative example of at least three independent experiments is shown in paraformaldehyde fixed cells (left) and nuclear positive Nrf2 cells and the total number of cells were quantified by counting 5 arbitrarily selected fields in a double-blinded manner and expressed as the total number of nuclear positive Nrf2 cells/field (right). The results are presented as means ± SD. Significant induction of nuclear positive Nrf2 cells of cells treated with EPDEN was analyzed in compared with the cells treated with PBS control (**P < 0.01, *P < 0.05). (e) Tcf/LEF-reporter mice starved overnight were gavage-administered twice a day for 3 days with 2 mg of EPDENs per mouse in 200 µl PBS or an equal amount of PBS as a control. X-gal staining (blue) of sectioned small intestine of B6.Cg-Tg(BAT-lacZ)3Picc/J mice. Tissues were counterstained with nuclear fast red (red). Original magnification ×40. One representative example of at least three independent experiments is shown (left panel), and number of X-gal+ cells were counted from 10 fields. Data show means ± SEM of three independent experiments with five mice per group. The error bars represent the standard error of the mean. *p < 0.05 compared with the control PBS group.

Similar articles

Cited by

References

    1. Patrick C, Wang GS, Lefebvre DE, Crookshank JA, et al. Promotion of autoimmune diabetes by cereal diet in the presence or absence of microbes associated with gut immune activation, regulatory imbalance, and altered cathelicidin antimicrobial Peptide. Diabetes. 2013;62:2036–2047. - PMC - PubMed
    1. Kozuka C, Yabiku K, Sunagawa S, Ueda R, et al. Brown rice and its component, gamma-oryzanol, attenuate the preference for high-fat diet by decreasing hypothalamic endoplasmic reticulum stress in mice. Diabetes. 2012;61:3084–3093. - PMC - PubMed
    1. Orr JS, Puglisi MJ, Ellacott KL, Lumeng CN, et al. Toll-like receptor 4 deficiency promotes the alternative activation of adipose tissue macrophages. Diabetes. 2012;61:2718–2727. - PMC - PubMed
    1. Pope JL, Bhat AA, Sharma A, Ahmad R, et al. Claudin-1 regulates intestinal epithelial homeostasis through the modulation of Notch-signalling. Gut. 2013 - PMC - PubMed
    1. Moossavi S, Zhang H, Sun J, Rezaei N. Host-microbiota interaction and intestinal stem cells in chronic inflammation and colorectal cancer. Expert Rev Clin Immunol. 2013;9:409–422. - PubMed

Publication types

MeSH terms