. 2014 Apr 24:3:e02130.
doi: 10.7554/eLife.02130.

A micro-epidemiological analysis of febrile malaria in Coastal Kenya showing hotspots within hotspots

Affiliations

A micro-epidemiological analysis of febrile malaria in Coastal Kenya showing hotspots within hotspots

Philip Bejon et al. Elife. .

Abstract

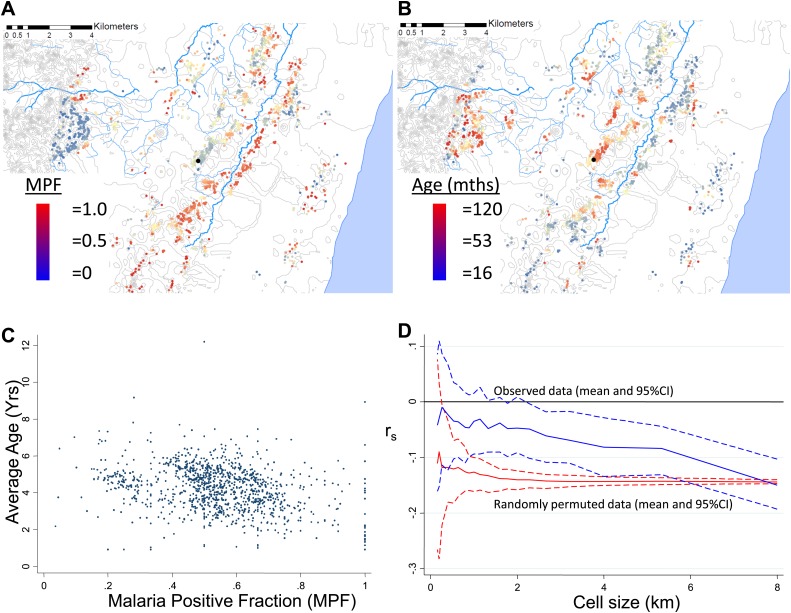
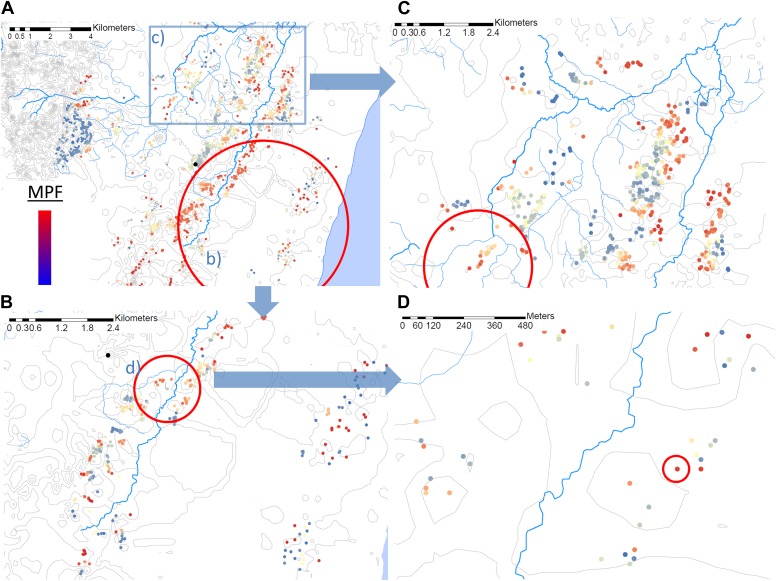
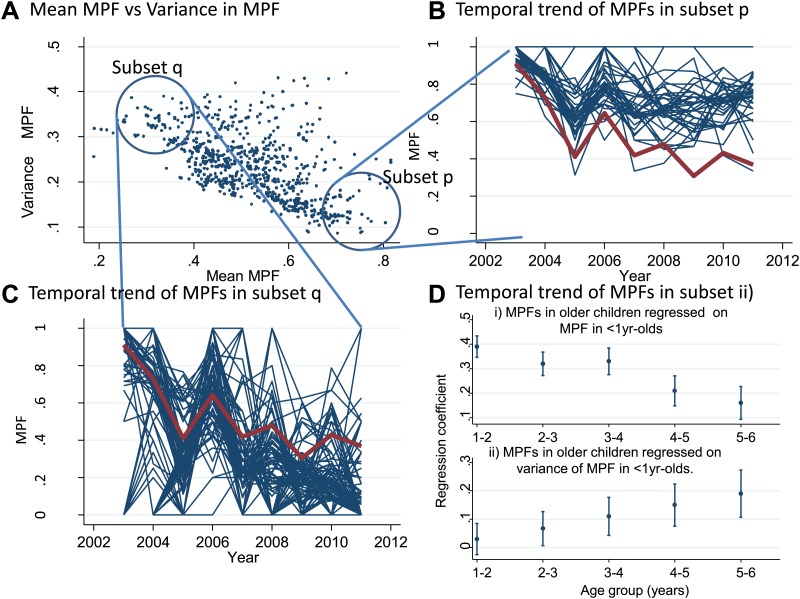
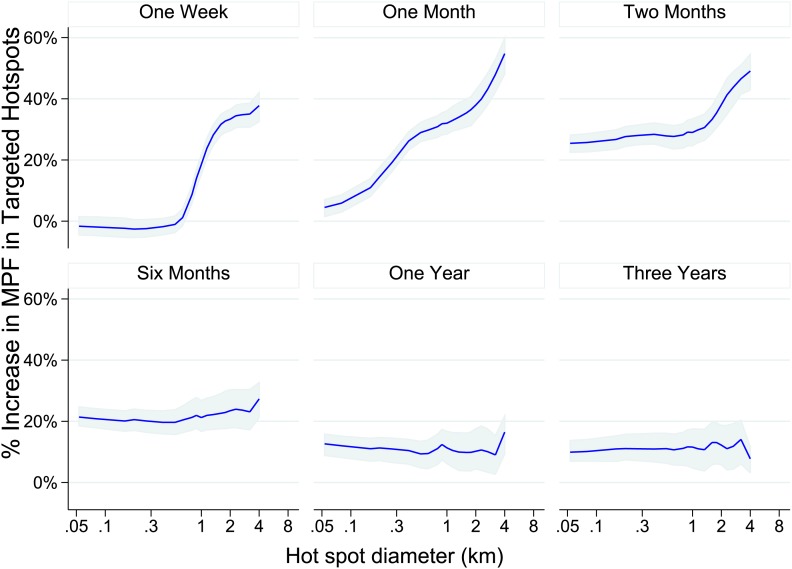
Malaria transmission is spatially heterogeneous. This reduces the efficacy of control strategies, but focusing control strategies on clusters or 'hotspots' of transmission may be highly effective. Among 1500 homesteads in coastal Kenya we calculated (a) the fraction of febrile children with positive malaria smears per homestead, and (b) the mean age of children with malaria per homestead. These two measures were inversely correlated, indicating that children in homesteads at higher transmission acquire immunity more rapidly. This inverse correlation increased gradually with increasing spatial scale of analysis, and hotspots of febrile malaria were identified at every scale. We found hotspots within hotspots, down to the level of an individual homestead. Febrile malaria hotspots were temporally unstable, but 4 km radius hotspots could be targeted for 1 month following 1 month periods of surveillance.DOI: http://dx.doi.org/10.7554/eLife.02130.001.

Keywords: falciparum; hotspot; malaria control; spatial epidemiology.


Conflict of interest statement

The authors declare that no competing interests exist.

Figures

Figure 1.
Figure 1.. Geographical distribution of malaria positive fraction and average age of febrile malaria.
Each plotted point represents an individual homestead, where the colour shading indicates the malaria positive fraction (MPF) in panel A, or the average age of children who test positive for malaria in panel B. Panel C shows the scatter plot for MPF vs average age (Spearman's rank correlation coefficient (rs) = −0.16, p<0.0001). Panel D shows rs (y axis) plotted against scale of analysis (x axis), where a grid with varying cell size is imposed on the study area, rs is calculated within each cell and then the mean rs presented, with 95% confidence intervals produced by boot-strap (blue solid and dashed lines, respectively), and the results of analysis of spatially-random permutations of the data with equivalent cell size are shown for comparison (red solid and dashed lines, respectively). The analysis shown in panel D was compared on simulations with varying simulated characteristic scales, Signal:Noise ratios and with added gradients (Figure 1—figure supplements 1–3, respectively). DOI: http://dx.doi.org/10.7554/eLife.02130.005
Figure 1—figure supplement 1.
Figure 1—figure supplement 1.. Simulated data with varying imposed scales of clustering.
Simulated data using imposed spatial clustering at specific scales are analysed to determine rs (y axis) plotted against scale of analysis (x axis), where a grid with varying cell size is imposed on the study area, rs is calculated within each cell and then the mean rs presented, with 95% confidence intervals produced by boot-strap (blue solid and dashed lines, respectively). The six panels show the appearances of different imposed scales as shown in the sub-titles. DOI: http://dx.doi.org/10.7554/eLife.02130.006
Figure 1—figure supplement 2.
Figure 1—figure supplement 2.. Simulated data with varying signal to noise ratios.
Simulated data using imposed spatial clustering at specific scales are analysed to determine rs (y axis) plotted against scale of analysis (x axis), where a grid with varying cell size is imposed on the study area, rs is calculated within each cell and then the mean rs presented, with 95% confidence intervals produced by boot-strap (blue solid and dashed lines, respectively). The six panels show the appearances using different Signal:Noise ratios. DOI: http://dx.doi.org/10.7554/eLife.02130.007
Figure 1—figure supplement 3.
Figure 1—figure supplement 3.. Simulated data with varying gradients around imposed scales of clustering.
Simulated data using imposed spatial clustering at specific scales are analysed to determine rs (y axis) plotted against scale of analysis (x axis), where a grid with varying cell size is imposed on the study area, rs is calculated within each cell and then the mean rs presented, with 95% confidence intervals produced by boot-strap (blue solid and dashed lines, respectively). The six panels show the appearances using gradients of varying spatial scales around the simulated clustering. DOI: http://dx.doi.org/10.7554/eLife.02130.008
Figure 2.
Figure 2.. Hotspots within hotspots.
Each plotted point represents an individual homestead, where the colour shading indicates the malaria positive fraction (MPF). Hotspots are identified using SATScan, using the whole study area (panel A), then repeated within the hotspot (panel B), within the hotspot of panel B (panel D), and then within a randomly chosen area outside the hotspot (panel C). The semi-variogram and log–log semi-variogram plot are shown in Figure 2—figure supplements 1 and 2, respectively. DOI: http://dx.doi.org/10.7554/eLife.02130.009
Figure 2—figure supplement 1.
Figure 2—figure supplement 1.. Semi-variogram.
The semi-variogram is shown for MPF. A lowess smoothed line is superimposed on the data points. DOI: http://dx.doi.org/10.7554/eLife.02130.010
Figure 2—figure supplement 2.
Figure 2—figure supplement 2.. Log-log plot of semi-variogram.
The log–log plot of the semi-variogram is shown for MPF. A lowess smoothed line is superimposed on the data points. DOI: http://dx.doi.org/10.7554/eLife.02130.011
Figure 3.
Figure 3.. Temporal variations in malaria positive fraction.
(Panel A) shows the scatter plot of individual homesteads by mean malaria positive fraction (MPF) on the x axis vs variance in MPF on the y axis (rs = −0.61, p<0.0001). A labelled blue circle indicates subset q (homesteads with high variance but low mean MPF) and subset p (homesteads with low variance and high mean MPF). The temporal trends for these two subsets are shown on panels (B and C), respectively. The median trend for the study area is shown in red. (Panel D) shows the regression coefficients (y axis) for the malaria positive fractions (MPF) in older children when regressed on; (i) the mean MPF in children <1 year of age (MPF<1y) and (ii) MPF in older children when regressed on the variance in MPF<1y over the 9 years of the study. Separate multivariable regression models (i.e., with mean MPF<1y and variance in MPF<1y as explanatory variables) are fit for each age group as shown on the x axis (excluding children <1 year of age, whose data are used to calculate MPF<1y). DOI: http://dx.doi.org/10.7554/eLife.02130.012
Figure 4.
Figure 4.. Theoretical accuracy of targeted control undertaken at varying temporal and spatial scales.
The accuracy of varying strategies of hotspot identification is shown. Each panel is labelled with the time period of surveillance data used. The x axis shows the diameter of hotspot defined. In each case hotspots were selected to account for 20% of the homesteads in the area. The y axis shows the increase that would have been present assuming that they were targeted in the time period following their identification. DOI: http://dx.doi.org/10.7554/eLife.02130.013

References

    1. Bejon P, Williams TN, Liljander A, Noor AM, Wambua J, Ogada E, Olotu A, Osier FH, Hay SI, Färnert A, Marsh K. 2010. Stable and unstable malaria hotspots in longitudinal cohort studies in Kenya. PLOS Medicine 7:e1000304. doi: 10.1371/journal.pmed.1000304 - DOI - PMC - PubMed
    1. Bousema T, Drakeley C, Gesase S, Hashim R, Magesa S, Mosha F, Otieno S, Carneiro I, Cox J, Msuya E, Kleinschmidt I, Maxwell C, Greenwood B, Riley E, Sauerwein R, Chandramohan D, Gosling R. 2010. Identification of hot spots of malaria transmission for targeted malaria control. The Journal of Infectious Diseases 201:1764–1774. doi: 10.1086/652456 - DOI - PubMed
    1. Bousema T, Griffin JT, Sauerwein RW, Smith DL, Churcher TS, Takken W, Ghani A, Drakeley C, Gosling R. 2012. Hitting hotspots: spatial targeting of malaria for control and elimination. PLOS Medicine 9:e1001165. doi: 10.1371/journal.pmed.1001165 - DOI - PMC - PubMed
    1. Brooker S, Clarke S, Njagi JK, Polack S, Mugo B, Estambale B, Muchiri E, Magnussen P, Cox J. 2004. Spatial clustering of malaria and associated risk factors during an epidemic in a highland area of western Kenya. Tropical Medicine & International Health: TM & IH 9:757–766. doi: 10.1111/j.1365-3156.2004.01272.x - DOI - PubMed
    1. Cairns M, Roca-Feltrer A, Garske T, Wilson AL, Diallo D, Milligan PJ, Ghani AC, Greenwood BM. 2012. Estimating the potential public health impact of seasonal malaria chemoprevention in African children. Nature Communications 3:881. doi: 10.1038/ncomms1879 - DOI - PMC - PubMed

Publication types