. 2014 Apr 29:3:e02557.
doi: 10.7554/eLife.02557.

Temporal dynamics and developmental memory of 3D chromatin architecture at Hox gene loci

Affiliations

Temporal dynamics and developmental memory of 3D chromatin architecture at Hox gene loci

Daan Noordermeer et al. Elife. .

Abstract

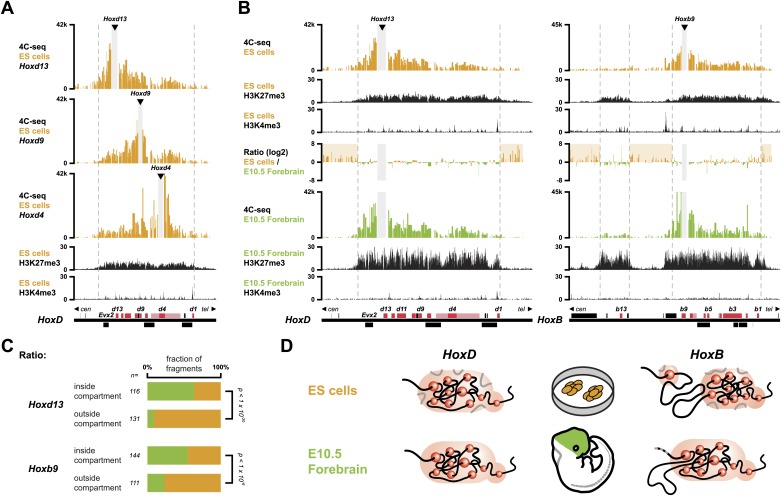
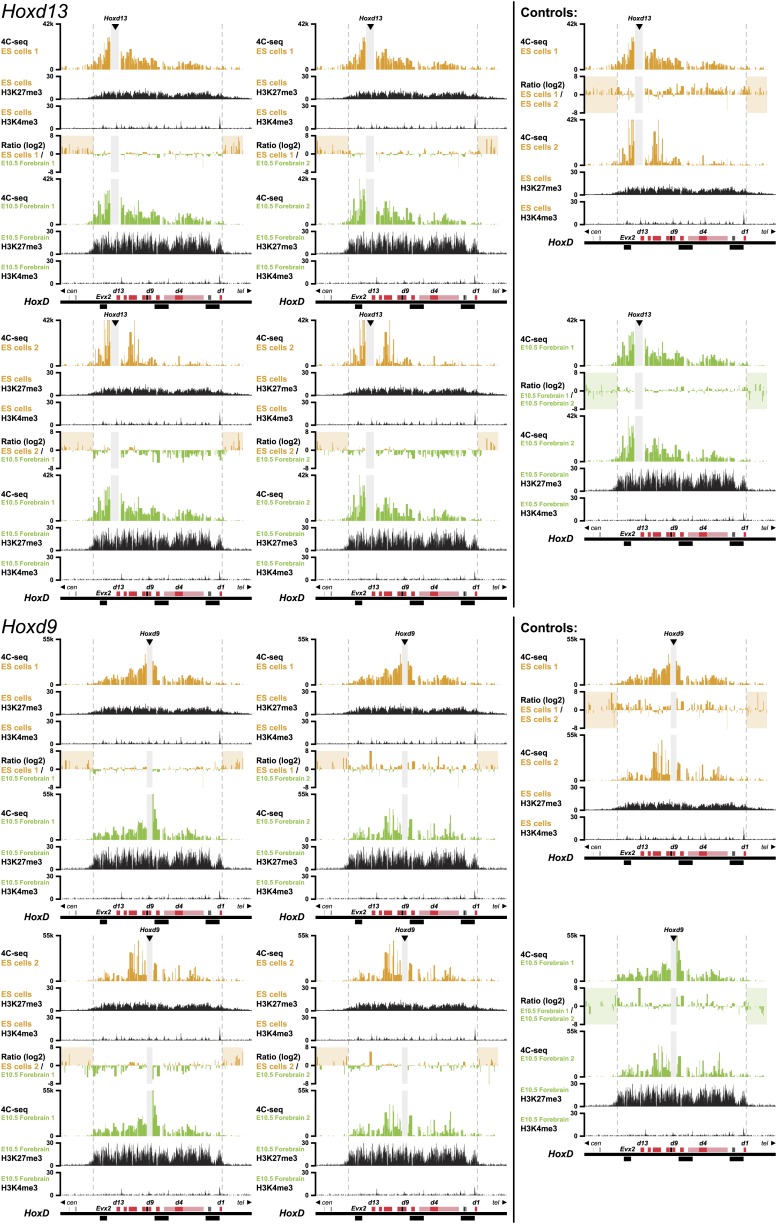
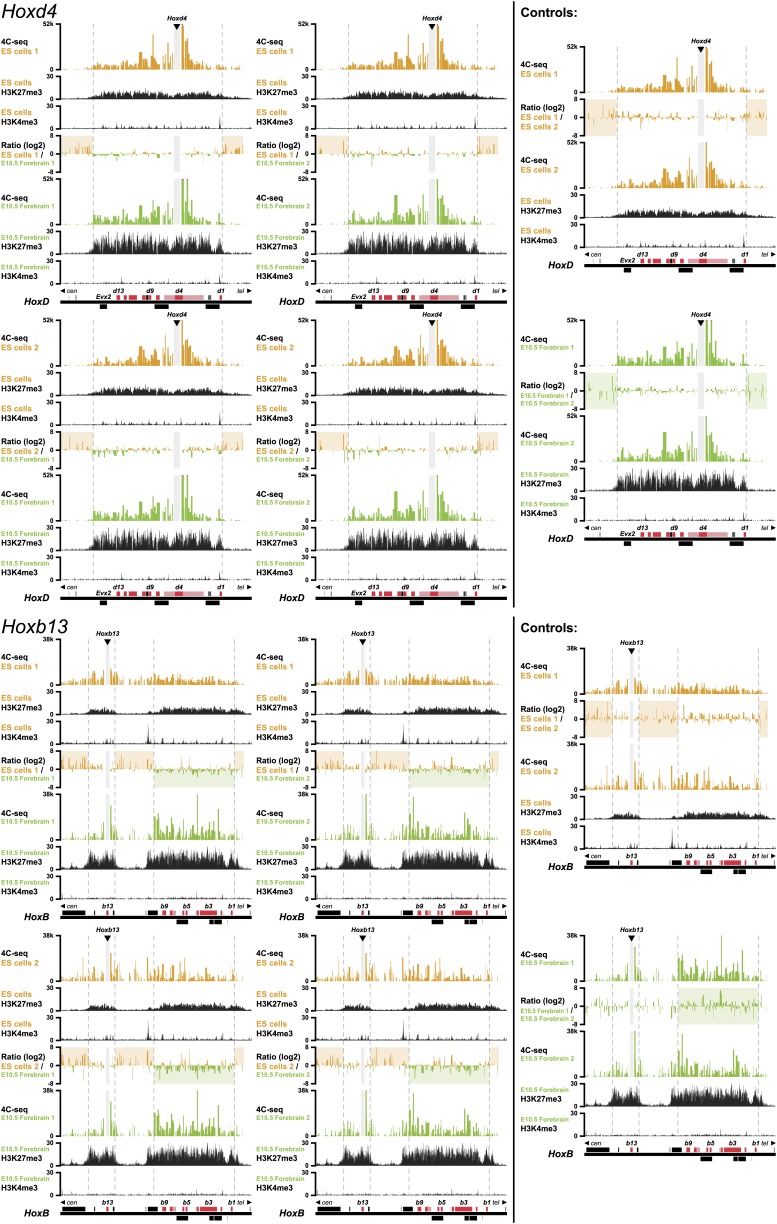
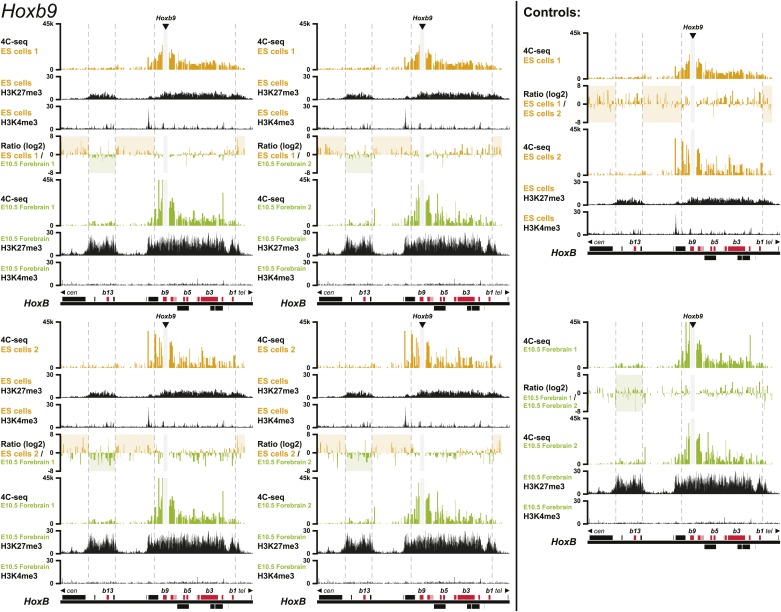
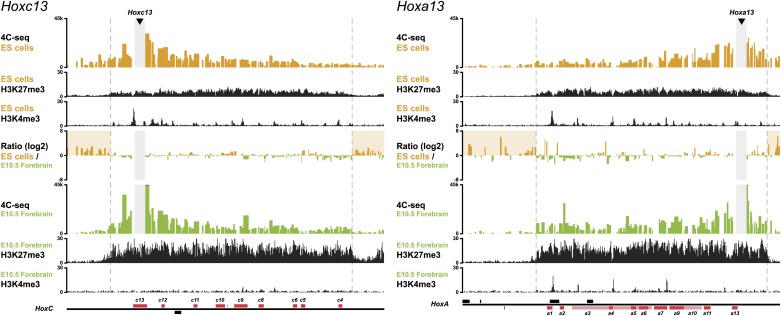
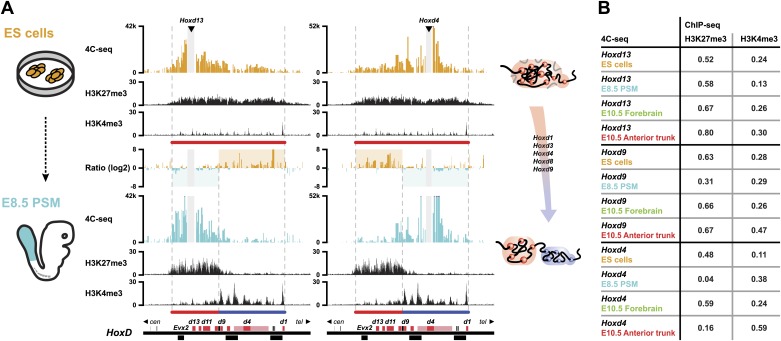
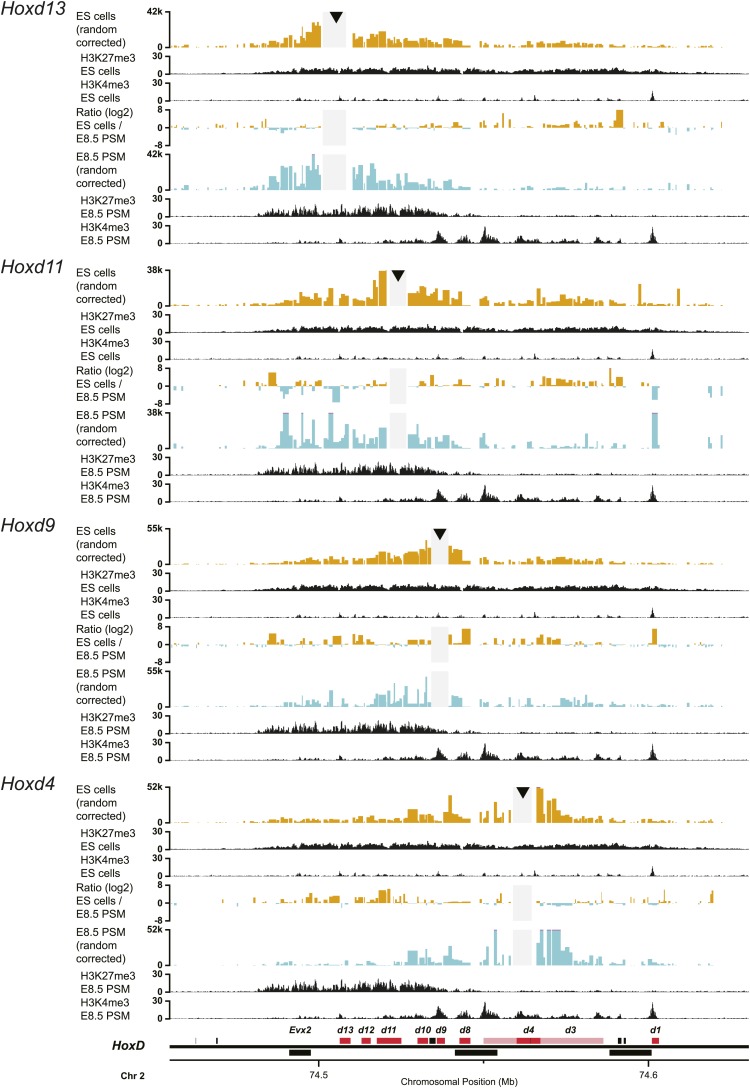
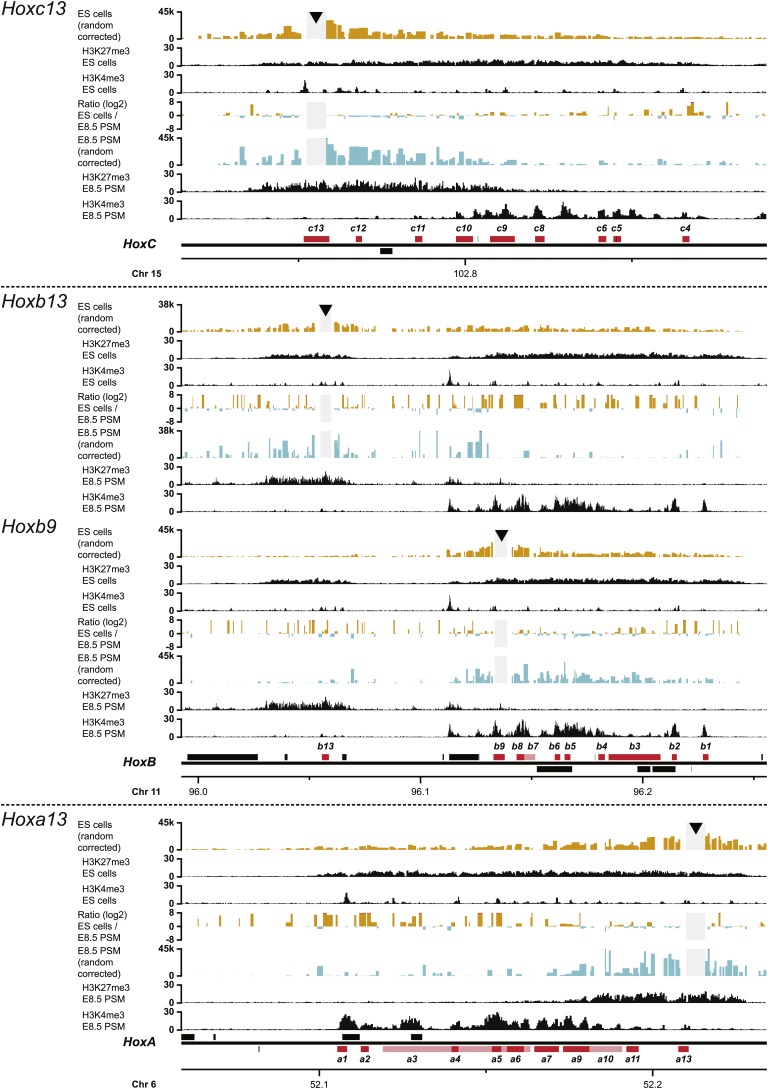
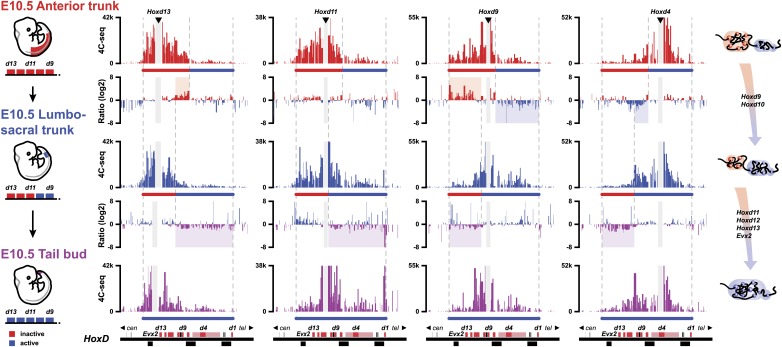
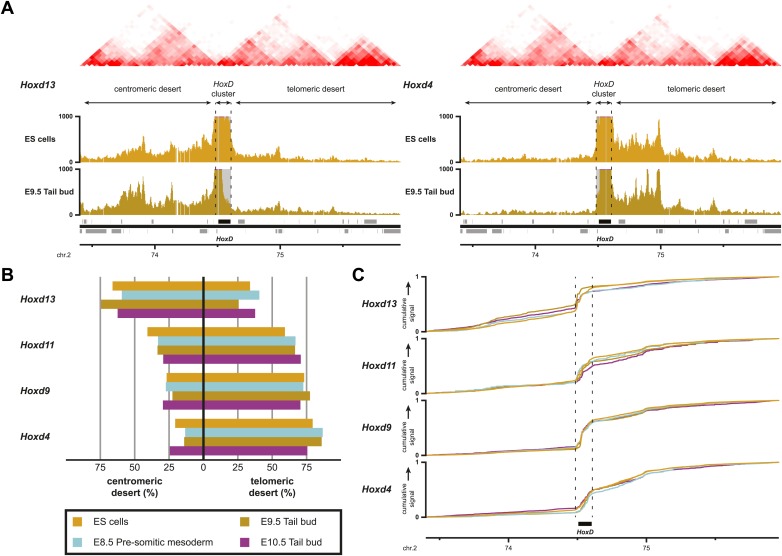
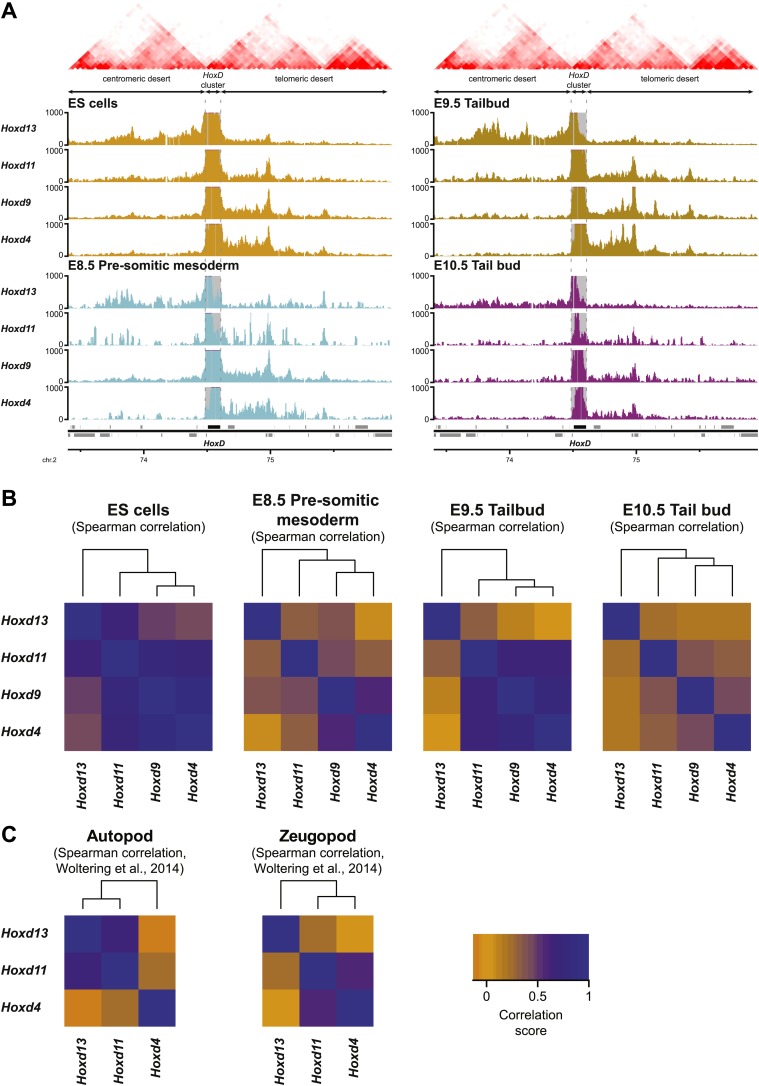
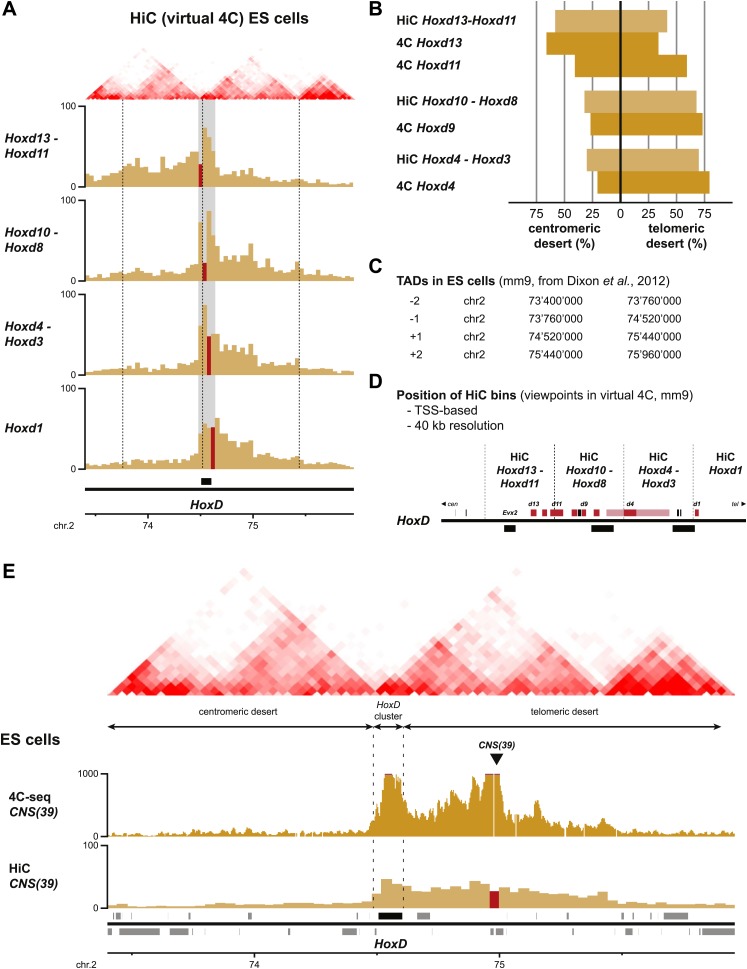
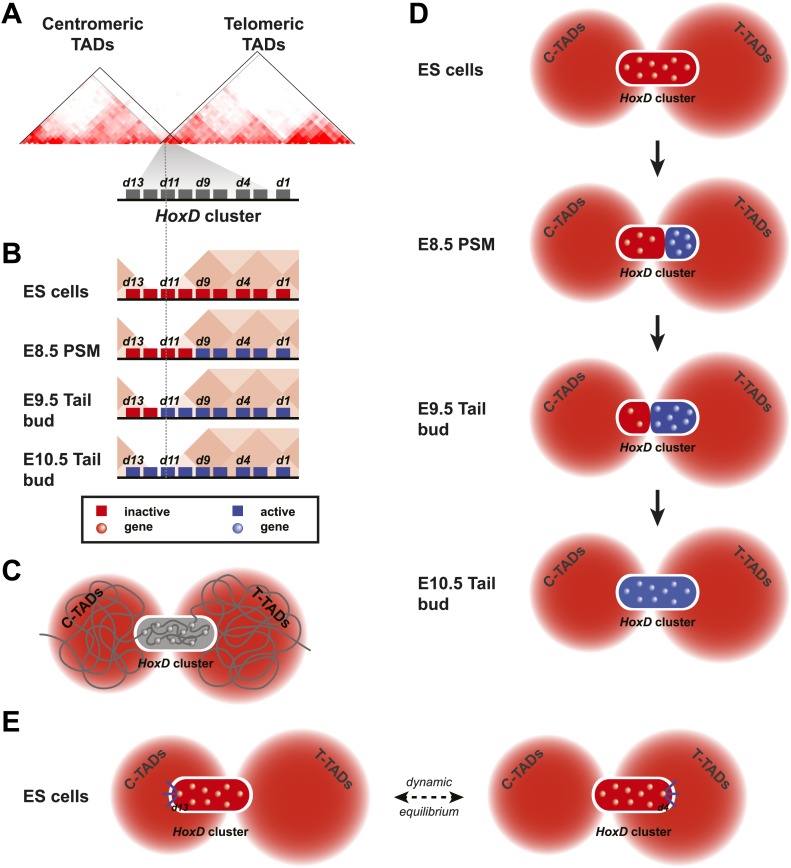
Hox genes are essential regulators of embryonic development. Their step-wise transcriptional activation follows their genomic topology and the various states of activation are subsequently memorized into domains of progressively overlapping gene products. We have analyzed the 3D chromatin organization of Hox clusters during their early activation in vivo, using high-resolution circular chromosome conformation capture. Initially, Hox clusters are organized as single chromatin compartments containing all genes and bivalent chromatin marks. Transcriptional activation is associated with a dynamic bi-modal 3D organization, whereby the genes switch autonomously from an inactive to an active compartment. These local 3D dynamics occur within a framework of constitutive interactions within the surrounding Topological Associated Domains, indicating that this regulation process is mostly cluster intrinsic. The step-wise progression in time is fixed at various body levels and thus can account for the chromatin architectures previously described at a later stage for different anterior to posterior levels.DOI: http://dx.doi.org/10.7554/eLife.02557.001.

Keywords: Hox gene regulation; chromatin domains; gene regulation; topological domains.


Conflict of interest statement

The authors declare that no competing interests exist.

Figures

Figure 1.
Figure 1.. Hox clusters in ES cells are organized as 3D compartments.
(A) Quantitative local 4C-seq signal for the Hoxd13 (top), Hoxd9 (middle) and Hoxd4 (bottom) viewpoints in ES cells. Below, the H3K27me3 and H3K4me3 ChIP-seq signals are aligned. The boundaries of the inactive Hox gene compartments are indicated by dashed lines. The locations of Hox genes (red) and of other transcripts (black) are shown below. (B) Quantitative local 4C-seq signal for the Hoxd13 (left) and Hoxb9 (right) viewpoints, either in ES (orange) or in E10.5 forebrain (green) cells. Below, the H3K27me3 and H3K4me3 ChIP-seq signals are aligned. Ratios between the 4C-seq signals in ES cells and E10.5 forebrain are indicated between the profiles, with signal in one color indicating that the viewpoint interacts more with this fragment in the sample represented by this color. Regions of increased interactions outside the 3D Hox gene compartments in ES cells are highlighted in orange. (C) Distribution of ratios inside and outside the inactive 3D Hox gene compartments in both ES and E10.5 forebrain cells. Fragments are classified either as positive in ES cells (orange), or positive in E10.5 forebrain cells (green). The number of fragments is indicated below. Significance between distribution inside and outside 3D compartments was calculated using a G-test of independence. (D) Model of 3D compartmentalization of the inactive HoxD and HoxB clusters in both ES cells and E10.5 forebrain cells. The increased contacts with the surrounding chromatin in ES cells are illustrated by invading grey lines. DOI: http://dx.doi.org/10.7554/eLife.02557.003
Figure 1—figure supplement 1.
Figure 1—figure supplement 1.. 3D compartments in the HoxD cluster are less discrete in ES cells than in embryonic brain cells.
Comparison of quantitative local 4C-seq signals for replicate samples with the indicated viewpoints, either in ES (orange) or E10.5 forebrain (green) cells. All six comparisons between two replicates in each condition are given. Viewpoints are indicated with arrowheads and regions excluded around the viewpoints are indicated with light grey boxes. Below, the H3K27me3 and H3K4me3 ChIP-seq signals are aligned. The ratios between 4C-seq signals are indicated between the corresponding profiles. The locations of Hoxd genes (red) and other transcripts (black) are shown below. Only regions covered by the random 4C-seq libraries are shown. DOI: http://dx.doi.org/10.7554/eLife.02557.004
Figure 1—figure supplement 2.
Figure 1—figure supplement 2.. 3D compartments in the HoxD and HoxB cluster are less discrete in ES cells than in embryonic brain cells.
Comparison of quantitative local 4C-seq signals for replicate samples with the indicated viewpoints, either in ES (orange) or E10.5 forebrain (green) cells. All six comparisons between two replicates in each condition are given. Viewpoints are indicated with arrowheads and regions excluded around the viewpoints are indicated with light grey boxes. Below, the H3K27me3 and H3K4me3 ChIP-seq signals are aligned. The ratios between 4C-seq signals are indicated between the corresponding profiles. The locations of Hoxd and Hoxb genes (red) and other transcripts (black) are shown below. Only regions covered by the random 4C-seq libraries are shown. DOI: http://dx.doi.org/10.7554/eLife.02557.005
Figure 1—figure supplement 3.
Figure 1—figure supplement 3.. 3D compartments in the HoxB cluster are less discrete in ES cells than in embryonic brain cells.
Comparison of quantitative local 4C-seq signals for replicate samples with the indicated viewpoints, either in ES (orange) or E10.5 forebrain (green) cells. All six comparisons between two replicates in each condition are given. Viewpoints are indicated with arrowheads and regions excluded around the viewpoints are indicated with light grey boxes. Below, the H3K27me3 and H3K4me3 ChIP-seq signals are aligned. The ratios between 4C-seq signals are indicated between the corresponding profiles. The locations of Hoxb genes (red) and other transcripts (black) are shown below. Only regions covered by the random 4C-seq libraries are shown. DOI: http://dx.doi.org/10.7554/eLife.02557.006
Figure 1—figure supplement 4.
Figure 1—figure supplement 4.. 3D compartments in the HoxC and HoxA cluster are less discrete in ES cells than in embryonic brain cells.
Comparison of quantitative local 4C-seq signals with the indicated viewpoints in ES (orange) or E10.5 forebrain (green) cells. Viewpoints are indicated with arrowheads and regions excluded around the viewpoints are indicated with light grey boxes. Below, the H3K27me3 and H3K4me3 ChIP-seq signals are aligned. The ratios between 4C-seq signals are indicated between the corresponding profiles. The locations of Hoxc and Hoxa genes (red) and other transcripts (black) are shown below. Only regions covered by the random 4C-seq libraries are shown. DOI: http://dx.doi.org/10.7554/eLife.02557.007
Figure 1—figure supplement 5.
Figure 1—figure supplement 5.. Distribution of ratios inside and outside the inactive 3D Hox gene compartments in both ES and E10.5 forebrain cells.
The comparison between replicate samples one (as used in the main text) is indicated on the left, the comparison between combined replicate samples is indicated at the center left, the comparison between ES cell replicates is indicated at the center right and the comparison between E10.5 forebrain replicates is indicated on the right. Fragments are classified as positive either in ES (orange) or in E10.5 forebrain (green) cells within the region covered by the random 4C-seq libraries. The number of fragments is indicated below. Significance between distribution inside and outside the 3D compartments was calculated using a G-test of independence. DOI: http://dx.doi.org/10.7554/eLife.02557.008
Figure 1—figure supplement 6.
Figure 1—figure supplement 6.. Different discretion of 3D compartments is not due to overall increased background signal.
(A) Distribution of 4C-seq signal on chromosome 2 from viewpoints in the HoxD cluster. On the right, a schematic representation of chromosome 2 is given, with color codes for the three categories that have been quantified in ES cells and E10.5 forebrain indicated below. Comparison of distributions between ES cells and E10.5 forebrain show that TAD signal in ES cells are considerably increased, but that more distal signal is reduced. Elevated signal in the TADs in ES cells is therefore not a representation of generally increased background signal. (B) Distribution of 4C-seq signal on chromosome 11 from viewpoints in the HoxB cluster. Similar effects are observed as for viewpoints in the HoxD cluster. DOI: http://dx.doi.org/10.7554/eLife.02557.009
Figure 1—figure supplement 7.
Figure 1—figure supplement 7.. Increased Hox background transcription in ES cells.
(A) Expression levels of Hox genes and of four housekeeping genes in both ES and E10.5 forebrain cells, as determined by RNA-seq. The large majority of Hox genes show low level activity in ES cells, whereas only few, very low, transcribed Hox genes are identified in E10.5 forebrain. In contrast, the expression levels of selected housekeeping genes are within a similar range (maximum threefold difference). (B) Overall gene expression patterns in ES and E10.5 forebrain cells are not significantly different. Box plots showing the overall distribution of RNA-seq signals per gene (RPKM), with colored boxes indicating the 25 to 75% range and whiskers indicating the 10 to 90% range. Differences between distributions were scored using a two-sided Welch two samples t test. (C) Quantitation of selected spliced Hox gene transcripts in ES cell and E10.5 forebrain samples as determined by RT-qPCR, with amounts in each sample relative to the Tubb2c gene. Below each sample, the specific product of a representative qPCR reaction is displayed. Color-coded dots are used to classify the different outcomes (see legend). DOI: http://dx.doi.org/10.7554/eLife.02557.010
Figure 2.
Figure 2.. Bi-modal 3D organization of Hox clusters upon sequential activation.
(A) Quantitative local 4C-seq signal for the Hoxd13 (left, centromeric side of HoxD cluster) and Hoxd4 (right, telomeric side of HoxD cluster) viewpoints, either in ES (orange), or E8.5 pre-somitic mesoderm (cyan) cells. Below, the H3K27me3 and H3K4me3 ChIP-seq profiles are aligned. The colinear expression status of Hoxd genes in each sample is schematized below the ChIP-seq profiles, with active genes in blue and inactive genes in red. Ratios between the 4C-seq signals in different samples are indicated between the profiles. The boundaries separating active from inactive Hox gene compartments are indicated by dashed lines. The locations of Hoxd genes (red) and other transcripts (black) are shown below. The samples are shown on the left and cartoons summarizing the genome organizations are indicated on the right. (B) Spearman's rank correlation coefficient between pairs of 4C-seq and ChIP-seq samples, in early and late embryonic material. DOI: http://dx.doi.org/10.7554/eLife.02557.012
Figure 2—figure supplement 1.
Figure 2—figure supplement 1.. Upon sequential activation, the HoxD cluster adopts a bi-modal 3D organization.
Quantitative local 4C-seq signals for the indicated Hoxd gene viewpoints. Profiles are displayed for ES (orange) and E8.5 pre-somitic mesoderm (cyan) cells. The viewpoints are indicated with arrowheads and excluded regions around the viewpoints are indicated with light grey boxes. Below, the H3K27me3 and H3K4me3 ChIP-seq signals are aligned. The ratios between 4C-seq signals are indicated between the respective profiles, with the signal in one particular color indicating that the viewpoint interacts more with fragments in the sample of the same color. The locations of Hoxd genes (red) and other transcripts (black) are shown below. Only the region covered by the random 4C-seq library is shown. DOI: http://dx.doi.org/10.7554/eLife.02557.013
Figure 2—figure supplement 2.
Figure 2—figure supplement 2.. Upon sequential activation, other Hox clusters adopt a bi-modal 3D organization as well.
Quantitative local 4C-seq signals for the indicated Hox gene viewpoints in other Hox clusters. Profiles are displayed for ES (orange) and E8.5 pre-somitic mesoderm (cyan) cells. The viewpoints are indicated with arrowheads and excluded regions around the viewpoints are indicated with light grey boxes. Below, the H3K27me3 and H3K4me3 ChIP-seq signals are aligned. The ratios between 4C-seq signals are indicated between the respective profiles, with the signal in one particular color indicating that the viewpoint interacts more with fragments in the sample of the same color. The locations of both Hox genes (red) and other transcripts (black) are shown below. Only regions covered by the random 4C-seq libraries are shown. DOI: http://dx.doi.org/10.7554/eLife.02557.014
Figure 3.
Figure 3.. Activated Hoxd genes switch compartments.
Quantitative local 4C-seq signals for the Hoxd13, Hoxd11 Hoxd9 and Hoxd4 viewpoints in either E8.5 pre-somitic mesoderm (cyan), E9.5 tail bud (brown) or E10.5 tail bud (purple) cells. The colinear expression status of Hoxd genes is schematized below each profile and, on the left, below each cartoon. Ratios between 4C-seq signals in different samples are indicated between the corresponding profiles. The boundaries between active and inactive Hox gene compartments are indicated by dashed lines and regions displaying important changes in interactions, as discussed in the text, are highlighted. Black arrows point towards opposing interacting behaviors due to the heterogeneous activity state of the viewpoint in the sample. The locations of Hoxd genes (red) and other transcripts (black) are shown below. DOI: http://dx.doi.org/10.7554/eLife.02557.015
Figure 4.
Figure 4.. The bimodal 3D organization of Hox cluster may help memorize states of colinear expression.
Quantitative local 4C-seq signals for the Hoxd13, Hoxd11 Hoxd9 and Hoxd4 viewpoints, in samples taken at various anterior to posterior positions along the developing body axis from E10.5 embryos. Anterior trunk (red), lumbo-sacral trunk (blue) and tail bud (purple) tissues were used and the approximate expression status of Hoxd genes in every sample is schematized below each profile (as for Figure 3). Ratios between 4C-seq signals in the different samples are indicated between the corresponding profiles. The boundaries between active and inactive Hox gene compartments are indicated by dashed lines and regions displaying important changes in interactions, as discussed in the text, are highlighted. The locations of Hoxd genes (red) and other transcripts (black) are shown below. On the right, cartoons summarizing the 3D genome organization of the HoxD cluster are indicated. DOI: http://dx.doi.org/10.7554/eLife.02557.016
Figure 5.
Figure 5.. Sequential Hoxd gene activation occurs without drastic remodeling of long-range interactions.
(A) Distribution of long-range contacts in both the centromeric and telomeric gene deserts surrounding the HoxD cluster. Smoothed 4C-seq signals (11 fragment window size) are shown for the Hoxd13 and Hoxd4 gene viewpoints in ES and E9.5 tail bud cells. The analyzed genomic interval is the same as in Woltering et al. (2014). The location of topological domains (TADs) in ES cells are obtained from Dixon et al. (2012) and indicated on the top with the HoxD cluster and both the centromeric and telomeric gene deserts indicated by arrows. The dashed lines demarcate the domain of high signal over the HoxD cluster, which is excluded from the analysis. (B) Summaries of the distributions in long-range signals within the centromeric and telomeric gene deserts surrounding the HoxD cluster, for all Hoxd genes assayed at various stages of their sequential activation. Each Hoxd gene specifically interacts with either the centromeric or the telomeric gene desert and these privileged contacts remain largely invariant during transcriptional activation. (C) Cumulative signals over the centromeric and telomeric gene deserts and the HoxD cluster for all Hoxd genes assayed at various stages of their sequential activation. DOI: http://dx.doi.org/10.7554/eLife.02557.017
Figure 5—figure supplement 1.
Figure 5—figure supplement 1.. Temporal colinearity occurs without dynamic long-range interactions.
(A) Distribution of long-range contacts in the centromeric and telomeric gene deserts surrounding the HoxD cluster. Smoothed 4C-seq signals (11 fragment window size) for the indicated HoxD viewpoints either in ES (orange), E8.5 pre-somitic mesoderm (cyan), E9.5 tail bud (brown) or E10.5 tail bud (purple) cells over the same genomic interval as analyzed in Woltering et al. (2014). Genomic location of the HoxD cluster and surrounding genes is indicated below. TADs observed in ES cells (from Dixon et al. 2012) are indicated on the top. The positions of both the HoxD cluster and the centromeric and telomeric gene deserts are indicated by arrows. The dashed lines demarcate the domain of high signals over the HoxD cluster, which is excluded from the analysis. (B) Hierarchical clustering of global patterns of long-range interactions in the surrounding gene deserts, for Hoxd viewpoints in ES cells and at different stages of sequential Hox gene activation. The Hoxd4, Hoxd11 and Hoxd13 viewpoints are consistently clustered together, with the Hoxd13 behaving as an outlier. The correlations between samples (indicated by heatmaps) were calculated using Spearman's ranking of smoothed 4C-seq signals (11 fragment window size) over the combined genomic intervals as used in Woltering et al. (2014), with the HoxD cluster itself excluded. The samples were subsequently clustered (top) according to standard hierarchical clustering. (C) Hierarchical clustering of global patterns of long-range interactions in the surrounding gene deserts for Hoxd viewpoints in autopod (digits) and zeugopod (limbs) cells. Data are from Woltering et al. (2014). DOI: http://dx.doi.org/10.7554/eLife.02557.018
Figure 5—figure supplement 2.
Figure 5—figure supplement 2.. Comparison between HiC and 4C-seq datasets obtained in ES cells.
(A) Virtual 4C carried out from HiC datasets, using bins covering the indicated Hoxd genes as viewpoints. Bins used as viewpoints are indicated in red. The interactions with bins covering the surrounding centromeric and telomeric TADs are given in light orange. TADs in ES cells (obtained from Dixon et al. 2012) are indicated on the top and the location of the HoxD cluster is indicated below. The dashed lines demarcate the assigned TAD boundaries in ES cells. (B) Comparison of the distribution of long-range signals in both the centromeric and telomeric gene deserts, as obtained either by virtual 4C (light orange, data from Dixon et al. 2012) or by 4C-seq (bright orange, this study). Despite large differences in both the size of the viewpoints and the resolution, the distribution is largely similar. The distribution of the HiC bin covering the promoters of the Hoxd13 and Hoxd11 genes behaves as a mix of the two individual 4C-seq viewpoints. (C) Coordinates of the centromeric and telomeric TADs surrounding the HoxD cluster (from Dixon et al. 2012). (D) Detailed location of the HiC bins covering the HoxD cluster. (E) 4C-seq and virtual 4C patterns obtained when using a viewpoint covering the regulatory region CNS39 (Andrey et al., 2013), within the telomeric gene desert. In contrast to Hoxd gene viewpoints, the interactions observed with the centromeric gene desert are near background. DOI: http://dx.doi.org/10.7554/eLife.02557.019
Figure 6.
Figure 6.. Model of dynamic bi-modal 3D compartmentalization during temporal colinearity.
(A) Schematic organization of topological domains in ES cells (from Dixon et al. 2012) matching the centromeric and telomeric gene deserts, with an apparent boundary assigned near the Hoxd11 gene (grey diagonal lines). All Hoxd genes in ES cells have considerable interactions on either side of the cluster, suggesting that this border is more diffuse and hence the entire HoxD cluster can be integrated in either TAD (diagonal black lines). (B) Various states of activity for Hoxd genes in different samples, analyzed during sequential activation. The assigned TAD boundary in ES cells is indicated by the dashed line. (C) Conceptual 2D representation of chromatin organization within the HoxD cluster chromatin compartment and surrounding centromeric and telomeric TADs in ES cells. (D) Schemes illustrating the dynamics of local 3D compartmentalization for the HoxD cluster (red and blue compartments) vs the constitutive nature of interactions in the context of the surrounding TADs during sequential activation. (E) A dynamic equilibrium to explain the paradox in the observed local vs long-range interactions. Genes located at the centromeric or telomeric extremities of the HoxD cluster form stable interactions with DNA sequences located with the flanking gene deserts, thereby dragging the HoxD 3D chromatin compartments into either one of the TADs. Within a cellular population, this process is in equilibrium, resulting in a read-out where Hoxd genes have a graded preference to interact with either the centromeric or the telomeric deserts, despite being organized into a single 3D chromatin compartment. DOI: http://dx.doi.org/10.7554/eLife.02557.020
Author response image 1.
Author response image 2.

References

    1. Almirantis Y, Provata A, Papageorgiou S. 2013. Evolutionary constraints favor a biophysical model explaining hox gene collinearity. Current Genomics 14:279–288. doi: 10.2174/13892029113149990003 - DOI - PMC - PubMed
    1. Andrey G, Montavon T, Mascrez B, Gonzalez F, Noordermeer D, Leleu M, Trono D, Spitz F, Duboule D. 2013. A switch between topological domains underlies HoxD genes collinearity in mouse limbs. Science 340:1234167. doi: 10.1126/science.1234167 - DOI - PubMed
    1. Bel-Vialar S, Core N, Terranova R, Goudot V, Boned A, Djabali M. 2000. Altered retinoic acid sensitivity and temporal expression of Hox genes in polycomb-M33-deficient mice. Developmental Biology 224:238–249. doi: 10.1006/dbio.2000.9791 - DOI - PubMed
    1. Berlivet S, Paquette D, Dumouchel A, Langlais D, Dostie J, Kmita M. 2013. Clustering of tissue-specific sub-TADs accompanies the regulation of HoxA genes in developing limbs. PLOS Genetics 9:e1004018. doi: 10.1371/journal.pgen.1004018 - DOI - PMC - PubMed
    1. Bernstein BE, Mikkelsen TS, Xie X, Kamal M, Huebert DJ, Cuff J, Fry B, Meissner A, Wernig M, Plath K, Jaenisch R, Wagschal A, Feil R, Schreiber SL, Lander ES. 2006. A bivalent chromatin structure marks key developmental genes in embryonic stem cells. Cell 125:315–326. doi: 10.1016/j.cell.2006.02.041 - DOI - PubMed

Publication types