. 2014 Jun 3;111(22):E2281-90.
doi: 10.1073/pnas.1407133111. Epub 2014 May 19.

Golgi and plasma membrane pools of PI(4)P contribute to plasma membrane PI(4,5)P2 and maintenance of KCNQ2/3 ion channel current

Affiliations

Golgi and plasma membrane pools of PI(4)P contribute to plasma membrane PI(4,5)P2 and maintenance of KCNQ2/3 ion channel current

Eamonn J Dickson et al. Proc Natl Acad Sci U S A. .

Abstract

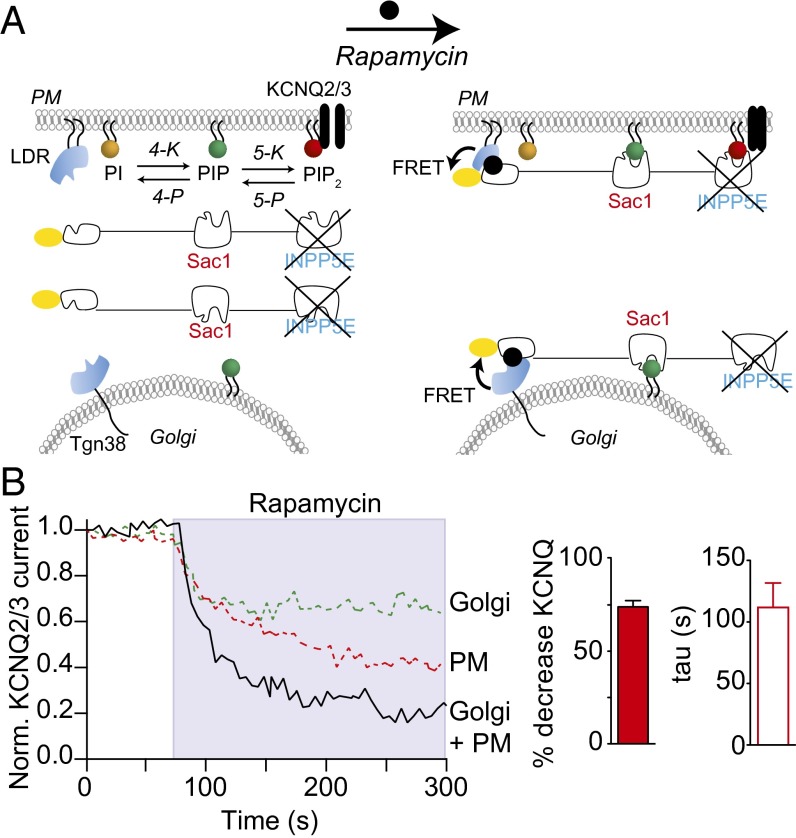
Plasma membrane (PM) phosphatidylinositol 4,5-bisphosphate [PI(4,5)P2] regulates the activity of many ion channels and other membrane-associated proteins. To determine precursor sources of the PM PI(4,5)P2 pool in tsA-201 cells, we monitored KCNQ2/3 channel currents and translocation of PHPLCδ1 domains as real-time indicators of PM PI(4,5)P2, and translocation of PHOSH2×2, and PHOSH1 domains as indicators of PM and Golgi phosphatidylinositol 4-phosphate [PI(4)P], respectively. We selectively depleted PI(4)P pools at the PM, Golgi, or both using the rapamycin-recruitable lipid 4-phosphatases. Depleting PI(4)P at the PM with a recruitable 4-phosphatase (Sac1) results in a decrease of PI(4,5)P2 measured by electrical or optical indicators. Depleting PI(4)P at the Golgi with the 4-phosphatase or disrupting membrane-transporting motors induces a decline in PM PI(4,5)P2. Depleting PI(4)P simultaneously at both the Golgi and the PM induces a larger decrease of PI(4,5)P2. The decline of PI(4,5)P2 following 4-phosphatase recruitment takes 1-2 min. Recruiting the endoplasmic reticulum (ER) toward the Golgi membranes mimics the effects of depleting PI(4)P at the Golgi, apparently due to the trans actions of endogenous ER Sac1. Thus, maintenance of the PM pool of PI(4,5)P2 appears to depend on precursor pools of PI(4)P both in the PM and in the Golgi. The decrease in PM PI(4,5)P2 when Sac1 is recruited to the Golgi suggests that the Golgi contribution is ongoing and that PI(4,5)P2 production may be coupled to important cell biological processes such as membrane trafficking or lipid transfer activity.

Keywords: phosphoinositides; pleckstrin homology domain; wortmannin.


Conflict of interest statement

The authors declare no conflict of interest.

Figures

Fig. 1.
Fig. 1.
Diagram of the four pseudojanin constructs and their names. PJ: engineered tandem 5-phosphatase (INPP5E) and 4-phosphatase (Sac1). PJ-4P: Only the 4-phosphatase is catalytically active. PJ-5P: Only the 5-phosphatase is active. PJ-Dead: Both enzymes are catalytically inactive. Each construct has an RFP (red oval) and FKBP domain at its N terminus.
Fig. 2.
Fig. 2.
Recruiting pseudojanin 4- and 5-phosphatases to the plasma membrane reduces plasma membrane PI(4,5)P2 and KCNQ2/3 current. (A) Schematic representation of PI(4)P depletion by pseudojanin-Sac (PJ-4P) recruitment to the PM. PI, phosphatidylinositol; PIP, phosphatidylinositol 4-phosphate; PIP2, phosphatidylinositol 4,5-bisphosphate; PHPLCδ1, pleckstrin homology domain of phospholipase Cδ1; Sac1, 4-phosphatase; INPP5E, 5-phosphatase. Recruitment of PJ-4P to the plasma membrane reduces PI(4,5)P2 levels at the plasma membrane. Inverted confocal micrographs of RFP-PJ-4P and PHPLCδ1 distribution before (Left) and after (Right) 5 μM rapamycin. (B) Averaged normalized time courses (symbols; n = 7) and single-exponential fits (solid lines) of plasma membrane PHPLCδ1 intensity following recruitment of PJ enzymes to plasma membrane with the addition of 5 μM rapamycin. PJ (triangles, green line); PJ-4P, PJ with 4-phosphatase only (INPP5E inactivated; circles, red line); PJ-5P, PJ with 5-phosphatase only (Sac inactivated; diamonds, blue line); PJ-Dead, mutant PJ with both phosphatases inactivated (squares, black line). (C) Averaged normalized time courses (n = 6) of KCNQ2/3 current with 5 μM rapamycin. (D) Summary of percentage decrease of KCNQ2/3 current (Left) and time constants of single-exponential fits (Right) after recruitment of four enzymes. (E) Averaged time courses of KCNQ2/3 current (left axis, black line) and FRETr between YFP-PJ-4P and LDR-CFP (right axis, red line) with application of 5 μM rapamycin and 10 μM oxotremorine-M. M1 muscarinic receptor is coexpressed. (F) Averaged time courses of KCNQ2/3 current (left axis, black line) and FRETr (right axis, red line) with application of 5 μM rapamycin and four activations of voltage-sensitive phosphatase by 1-s depolarizations to +100 mV (asterisks).
Fig. 3.
Fig. 3.
Recruiting pseudojanin 4-phosphatase to the Golgi reduces Golgi PI(4)P and plasma membrane KCNQ2/3 current. (A) Schematic of PI(4)P depletion following PJ-4P recruitment to the Golgi. OSH1, oxysterol-binding protein homolog 1. Inverted confocal images of PJ-4P and PHOSH1 before and after 5 μM rapamycin. (B) Averaged normalized time courses (n = 7) of the Golgi intensity of the PI(4)P probe OSH1 with addition of 5 μM rapamycin in the presence of each of the four recruitable PJ enzymes. (Inset) Inverted confocal images of a representative cell before (Upper) and during (Lower) the recruitment of PJ-4P by rapamycin. Note same cell as in A. (Right) Summary of percentage decrease of OSH1 Golgi intensity and time constants (tau) of single-exponential fits after enzyme recruitment. (C) Averaged normalized time courses of KCNQ2/3 current with addition of 5 μM rapamycin in the presence of three Golgi-targeted enzymes. (Right) Summary of percentage decrease of KCNQ2/3 current (Left) and time constants of single-exponential fits (Right) after enzyme recruitment. (D) Averaged time courses of KCNQ2/3 current (left axis, black line) and FRETr between YFP-PJ-4P and LDR-CFP (right axis, red line) with application of 5 μM rapamycin and 10 μM oxotremorine-M. M1 muscarinic receptor is coexpressed.
Fig. 4.
Fig. 4.
Recruiting PJ-4P to the plasma membrane and simultaneously to the Golgi reduces KCNQ2/3 current in an additive manner. (A) Schematic of PJ-4P recruitment to both the plasma membrane and the trans-Golgi network. The INPP5E 5-phosphatase is inactivated, leaving only Sac1 4-phosphatase activity. (B) Averaged normalized time courses (n = 5) of KCNQ2/3 current with addition of 5 μM rapamycin. For comparison, data are plotted for recruitment to the Golgi (green line) or the plasma membrane (red line) alone. (Right) Summary of percentage decrease of KCNQ2/3 current and time constant (tau) of single-exponential fits.
Fig. 5.
Fig. 5.
Inhibitors of type II and type III PI 4-kinases reduce plasma membrane PI(4,5)P2. (A) Representative time course of KCNQ2/3 current in a control cell. (B) Time course of KCNQ2/3 current with addition of 30 μM wortmannin. (C) Time course of KCNQ2/3 current in a cell with 500 μM adenosine in the patch pipette solution. (D) Time course of FRETr between YFP-PHPLCδ1 and CFP- PHPLCδ1 in cells with (red line) or without (black line: control) 500 μM adenosine in the patch pipette solution. Arrow indicates transition from on-cell to whole-cell patch clamp configuration, beginning the dialysis of adenosine into the cell. Note that there is only a small change in FRETr after achieving “whole-cell” in control conditions, indicating that only a small amount of PHPLCδ1 has dialyzed out of the cell. Yellow bar marks the addition of 10 μM oxotremorine-M. M1 muscarinic receptor is coexpressed. (E) Time course of KCNQ2/3 current in a cell with 1 mM adenosine in the pipette solution and bath exposure to 50 μM wortmannin and 10 μM oxotremorine-M. M1 muscarinic receptor is coexpressed. (F) Summary of percentage decrease (Left) of KCNQ2/3 current and PHPLCδ1 intensity and time constant of single-exponential fit (Right) after addition of 30 μM wortmannin (n = 8) or 1 mM adenosine (n = 10).
Fig. 6.
Fig. 6.
Inhibitors of Golgi trafficking or myosin II ATPase activity reduce PM PI(4,5)P2. (A) Time course of KCNQ2/3 current with addition of 5 μg/mL BFA. (B) As in A, with addition of 10 μM oxotremorine-M, M1R is overexpressed. (C) Time course of normalized YFP-PHPLCδ1 intensity within a TIRF footprint following the addition of BFA. (D) As in C, with the addition of the muscarinic agonist, Oxo-M (10 μM), M1R is overexpressed. (E) As in A and B, with the addition of 30 μM wortmannin. (F) Summary of percentage decrease (Left) and time constant of single-exponential fit (Right) of KCNQ2/3 current and YFP-PHPLCδ1 intensity after BFA alone (KCNQ2/3: n = 10; YFP-PHPLCδ1: n = 6). Note that the percentage change in YFP-PHPLCδ1 intensity is normalized to Oxo-M response. (G) Time course of KCNQ2/3 current with addition of 20 mM BDM. (H) Summary of percentage decrease of KCNQ2/3 current (Left) and time constant of single-exponential fit (Right) after addition of 20 mM BDM (n = 7). (I) Time course of KCNQ2/3 current following the addition of blebbistatin (30 μM) and Oxo-M (10 μM). (J) Time course of normalized YFP-PHPLCδ1 intensity within a TIRF footprint following the addition of blebbistatin and Oxo-M. (K) Same cell as in J. (Upper) Inverted TIRF footprints from a cell expressing YFP-PHPLCδ1 before, during, and after blebbistatin and Oxo-M. (Lower) Kymograph of YFP-PHPLCδ1 intensity taken from black line. (L) Summary of percentage decrease (Left) and time constant of single-exponential fit (Right) of KCNQ2/3 current and YFP-PHPLCδ1 intensity after blebbistatin alone (KCNQ2/3: n = 5; YFP-PHPLCδ1: n = 10). Note that the percentage change in YFP-PHPLCδ1 intensity is normalized to the Oxo-M response.
Fig. 7.
Fig. 7.
Recruiting the endoplasmic reticulum to the Golgi depletes Golgi PI(4)P. (A) Averaged (n = 7 ± SEM) normalized time course of Golgi intensity of Tgn-FRB (blue line) and PHOSH1 (green line) with the addition of 5 μM rapamycin to recruit ER-localized CB5-FKBP in apposition to the Golgi. (Right) Confocal images of two cells with PHOSH1 before (Upper) and during (Lower) rapamycin. Tgn-FRB, trans-Golgi network-localized anchor; CB5-FKBP, chromogranin B5 bait localized to the endoplasmic reticulum. (B) Time course of KCNQ2/3 current with application of 5 μM rapamycin and 10 μM oxotremorine-M. M1 muscarinic receptor is coexpressed. (Right) Summary of percentage decrease of KCNQ2/3 current and single-exponential time constant (n = 8). (C) Schematic of phosphoinositide synthesis via the plasma membrane, the endoplasmic reticulum, and the Golgi. GDP-DAG, GDP-diacylglycerol; PIS, phosphatidylinositol synthase; PIP’some, PIPerosome; PITPs, phosphatidylinositol transfer proteins. Blue arrows indicate transfer pathways of phosphatidylinositols between compartments; black arrows indicate phosphoinositide synthesis.

Similar articles

Cited by

References

    1. Balla T. Phosphoinositides: Tiny lipids with giant impact on cell regulation. Physiol Rev. 2013;93(3):1019–1137. - PMC - PubMed
    1. Doughman RL, Firestone AJ, Anderson RA. Phosphatidylinositol phosphate kinases put PI4,5P2 in its place. J Membr Biol. 2003;194(2):77–89. - PubMed
    1. Majerus PW, York JD. Phosphoinositide phosphatases and disease. J Lipid Res. 2009;50(Suppl):S249–S254. - PMC - PubMed
    1. Di Paolo G, De Camilli P. Phosphoinositides in cell regulation and membrane dynamics. Nature. 2006;443(7112):651–657. - PubMed
    1. Zhao X, et al. Interaction of neuronal calcium sensor-1 (NCS-1) with phosphatidylinositol 4-kinase β stimulates lipid kinase activity and affects membrane trafficking in COS-7 cells. J Biol Chem. 2001;276(43):40183–40189. - PubMed

Publication types

MeSH terms